QUESTION IMAGE
Question
problem 6 (example 6)
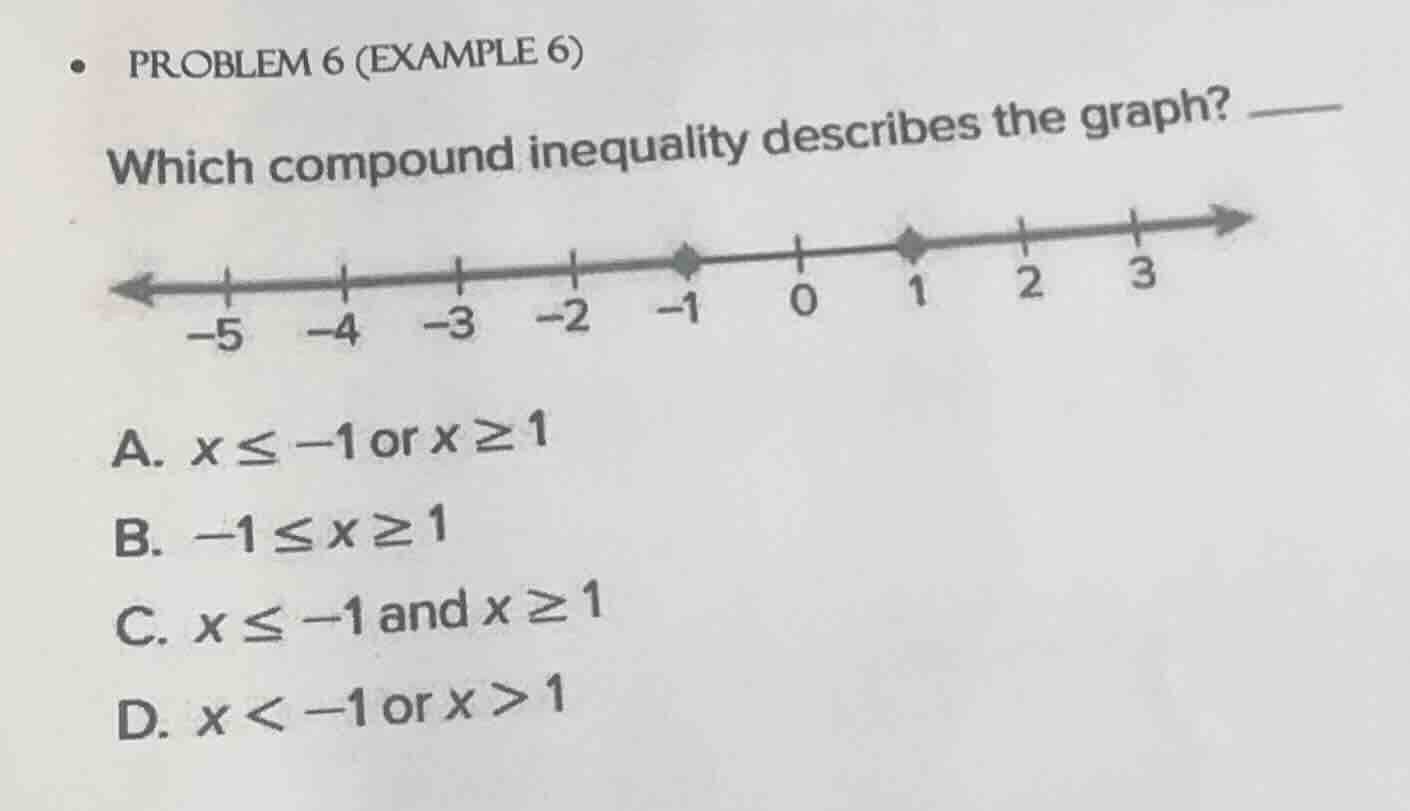
which compound inequality describes the graph?
number line with -5, -4, -3, -2, -1, 0, 1, 2, 3; filled dots at -1 and 1, arrows left from -1 and right from 1
a. $x \leq -1$ or $x \geq 1$
b. $-1 \leq x \geq 1$
c. $x \leq -1$ and $x \geq 1$
d. $x < -1$ or $x > 1$
Step1: Analyze closed dots on graph
The graph has closed (filled) dots at $x=-1$ and $x=1$, so these values are included in the solution set.
Step2: Analyze arrow directions
The arrow from $x=-1$ points left (all values less than or equal to $-1$), and the arrow from $x=1$ points right (all values greater than or equal to $1$). This is an "or" compound inequality, as the solution set is two separate ranges.
Step3: Match to options
Option A states $x \leq -1 \text{ or } x \geq 1$, which matches the graph's closed dots and arrow directions. Options B and C use invalid or incorrect logical connectors, and Option D uses open inequality symbols which do not match the closed dots.

Snap & solve any problem in the app
Get step-by-step solutions on Sovi AI
Photo-based solutions with guided steps
Explore more problems and detailed explanations
A. $x \leq -1$ or $x \geq 1$