QUESTION IMAGE
Question
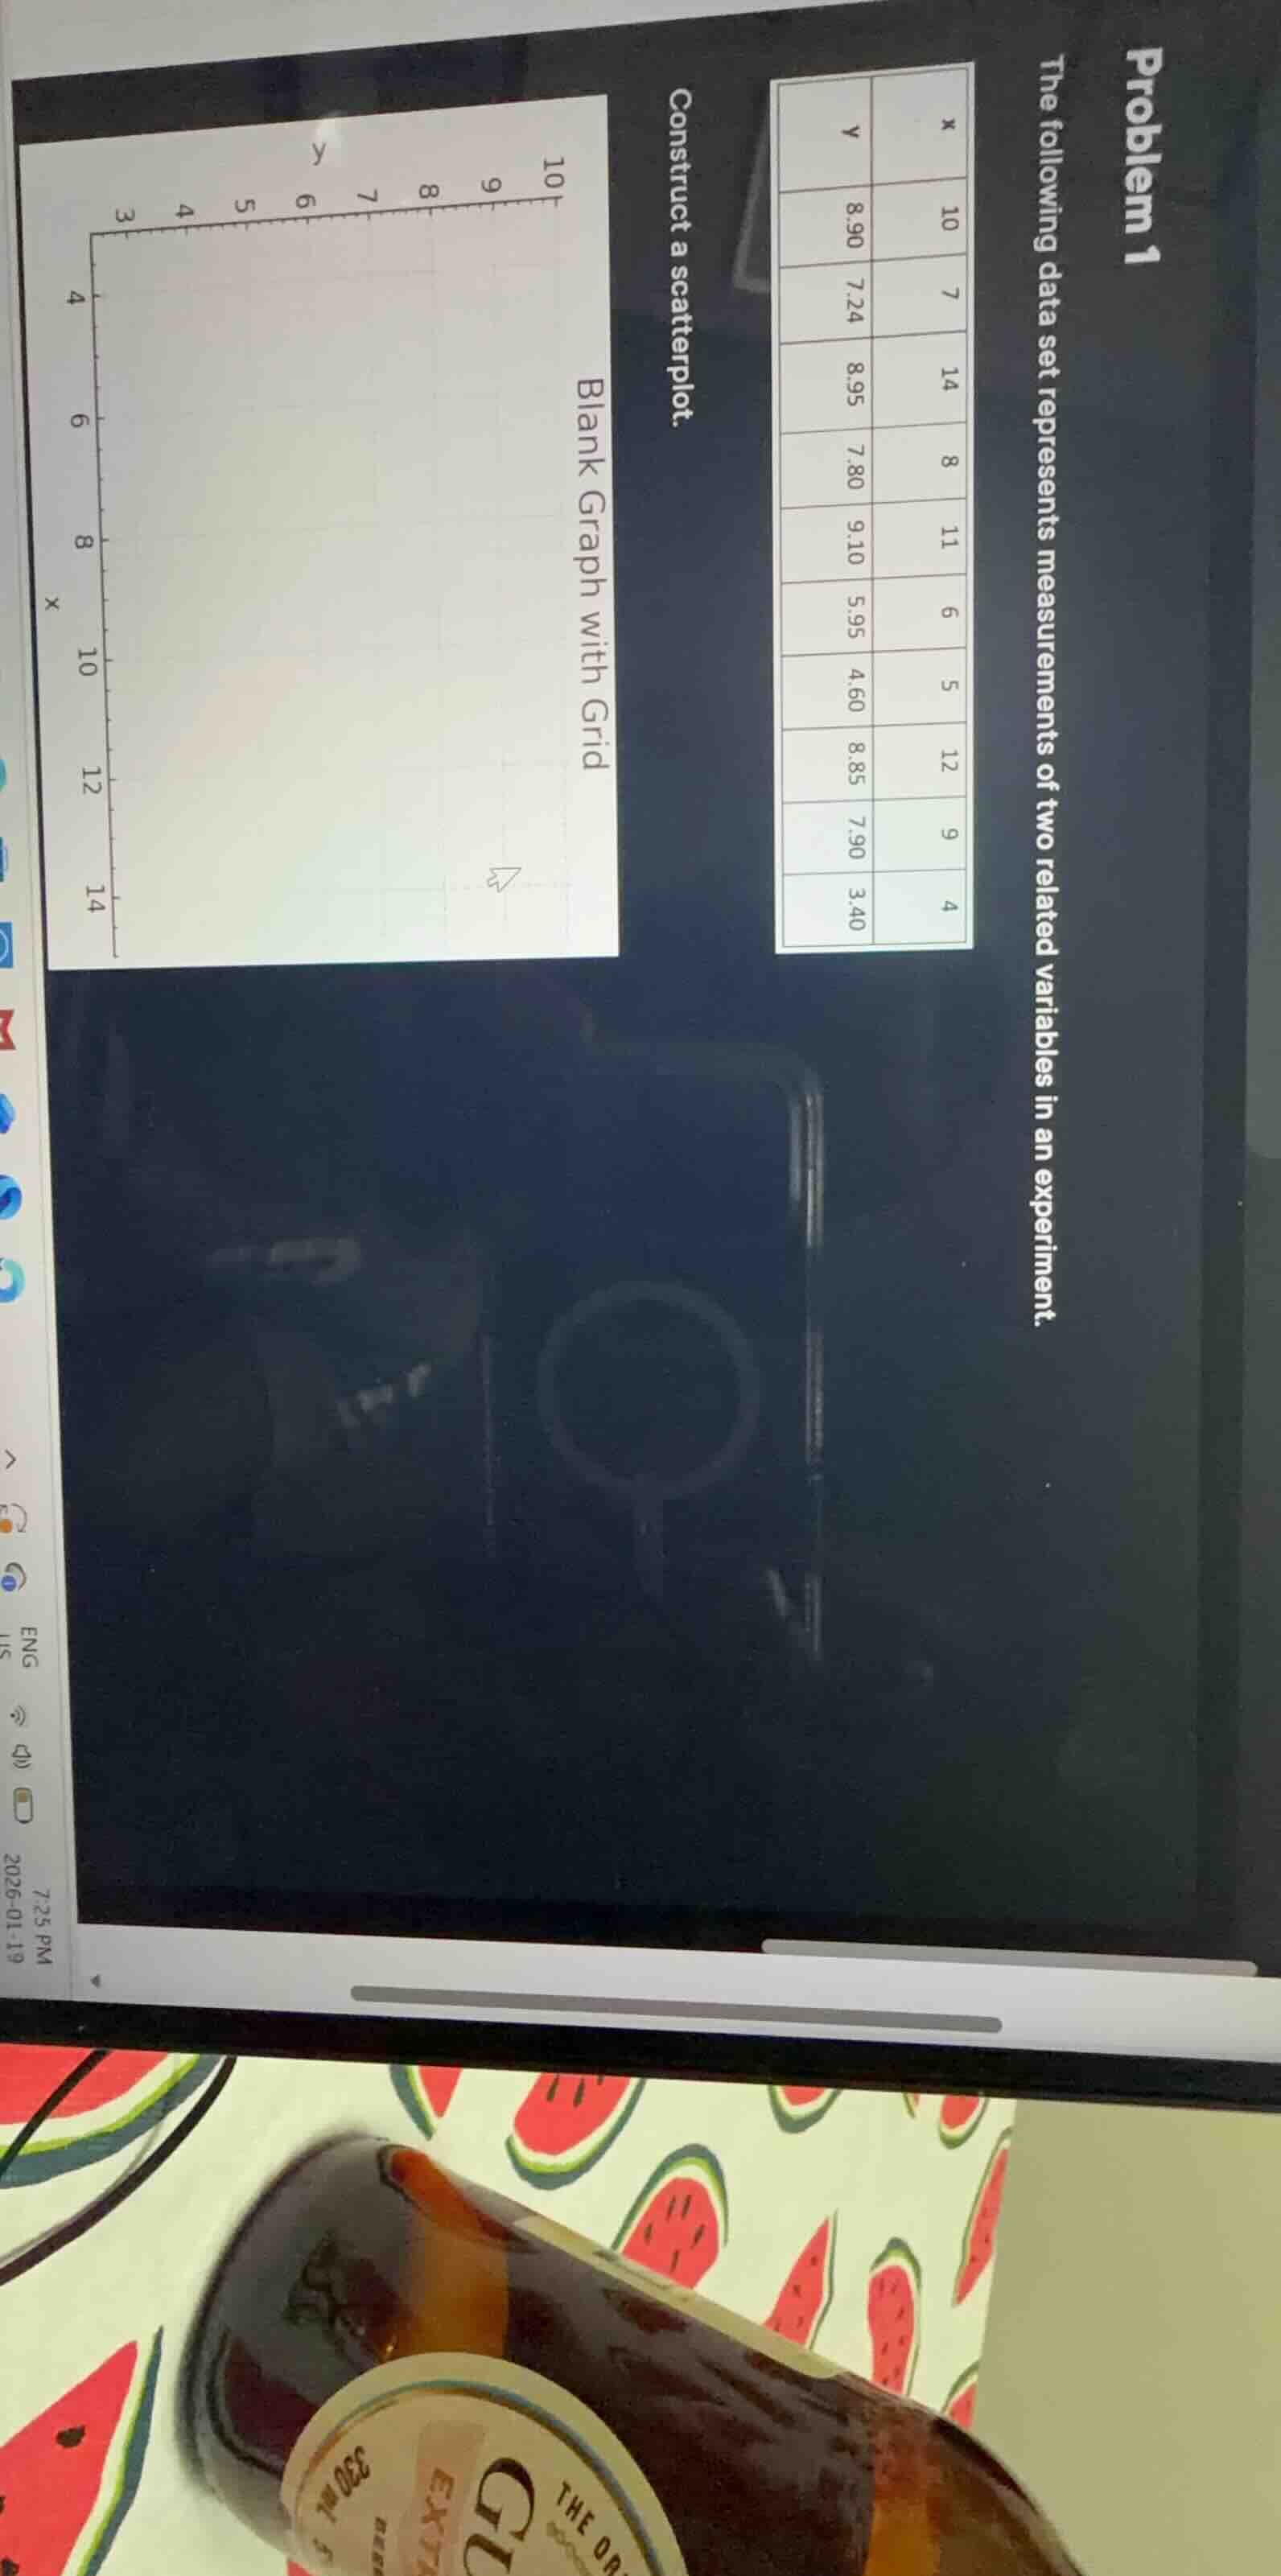
problem 1
the following data set represents measurements of two related variables in an experiment.
construct a scatterplot.
blank graph with grid
Step1: Identify x and y values
The data pairs are: (10, 8.90), (7, 7.24), (14, 8.95), (8, 7.80), (11, 9.10), (6, 5.95), (5, 4.60), (12, 8.85), (9, 7.90), (4, 3.40).
Step2: Set up the scatterplot grid
The x - axis (horizontal) has values from 3 - 14 (as per the grid) and the y - axis (vertical) has values from 3 - 10 (as per the grid).
Step3: Plot each data point
- For (10, 8.90): Find x = 10 on the x - axis and y = 8.90 on the y - axis, mark the point.
- For (7, 7.24): Find x = 7 on the x - axis and y = 7.24 on the y - axis, mark the point.
- For (14, 8.95): Find x = 14 on the x - axis and y = 8.95 on the y - axis, mark the point.
- For (8, 7.80): Find x = 8 on the x - axis and y = 7.80 on the y - axis, mark the point.
- For (11, 9.10): Find x = 11 on the x - axis and y = 9.10 on the y - axis, mark the point.
- For (6, 5.95): Find x = 6 on the x - axis and y = 5.95 on the y - axis, mark the point.
- For (5, 4.60): Find x = 5 on the x - axis and y = 4.60 on the y - axis, mark the point.
- For (12, 8.85): Find x = 12 on the x - axis and y = 8.85 on the y - axis, mark the point.
- For (9, 7.90): Find x = 9 on the x - axis and y = 7.90 on the y - axis, mark the point.
- For (4, 3.40): Find x = 4 on the x - axis and y = 3.40 on the y - axis, mark the point.

Snap & solve any problem in the app
Get step-by-step solutions on Sovi AI
Photo-based solutions with guided steps
Explore more problems and detailed explanations
The scatterplot is constructed by plotting the points (10, 8.90), (7, 7.24), (14, 8.95), (8, 7.80), (11, 9.10), (6, 5.95), (5, 4.60), (12, 8.85), (9, 7.90), (4, 3.40) on the given grid with x - axis (3 - 14) and y - axis (3 - 10).