QUESTION IMAGE
Question
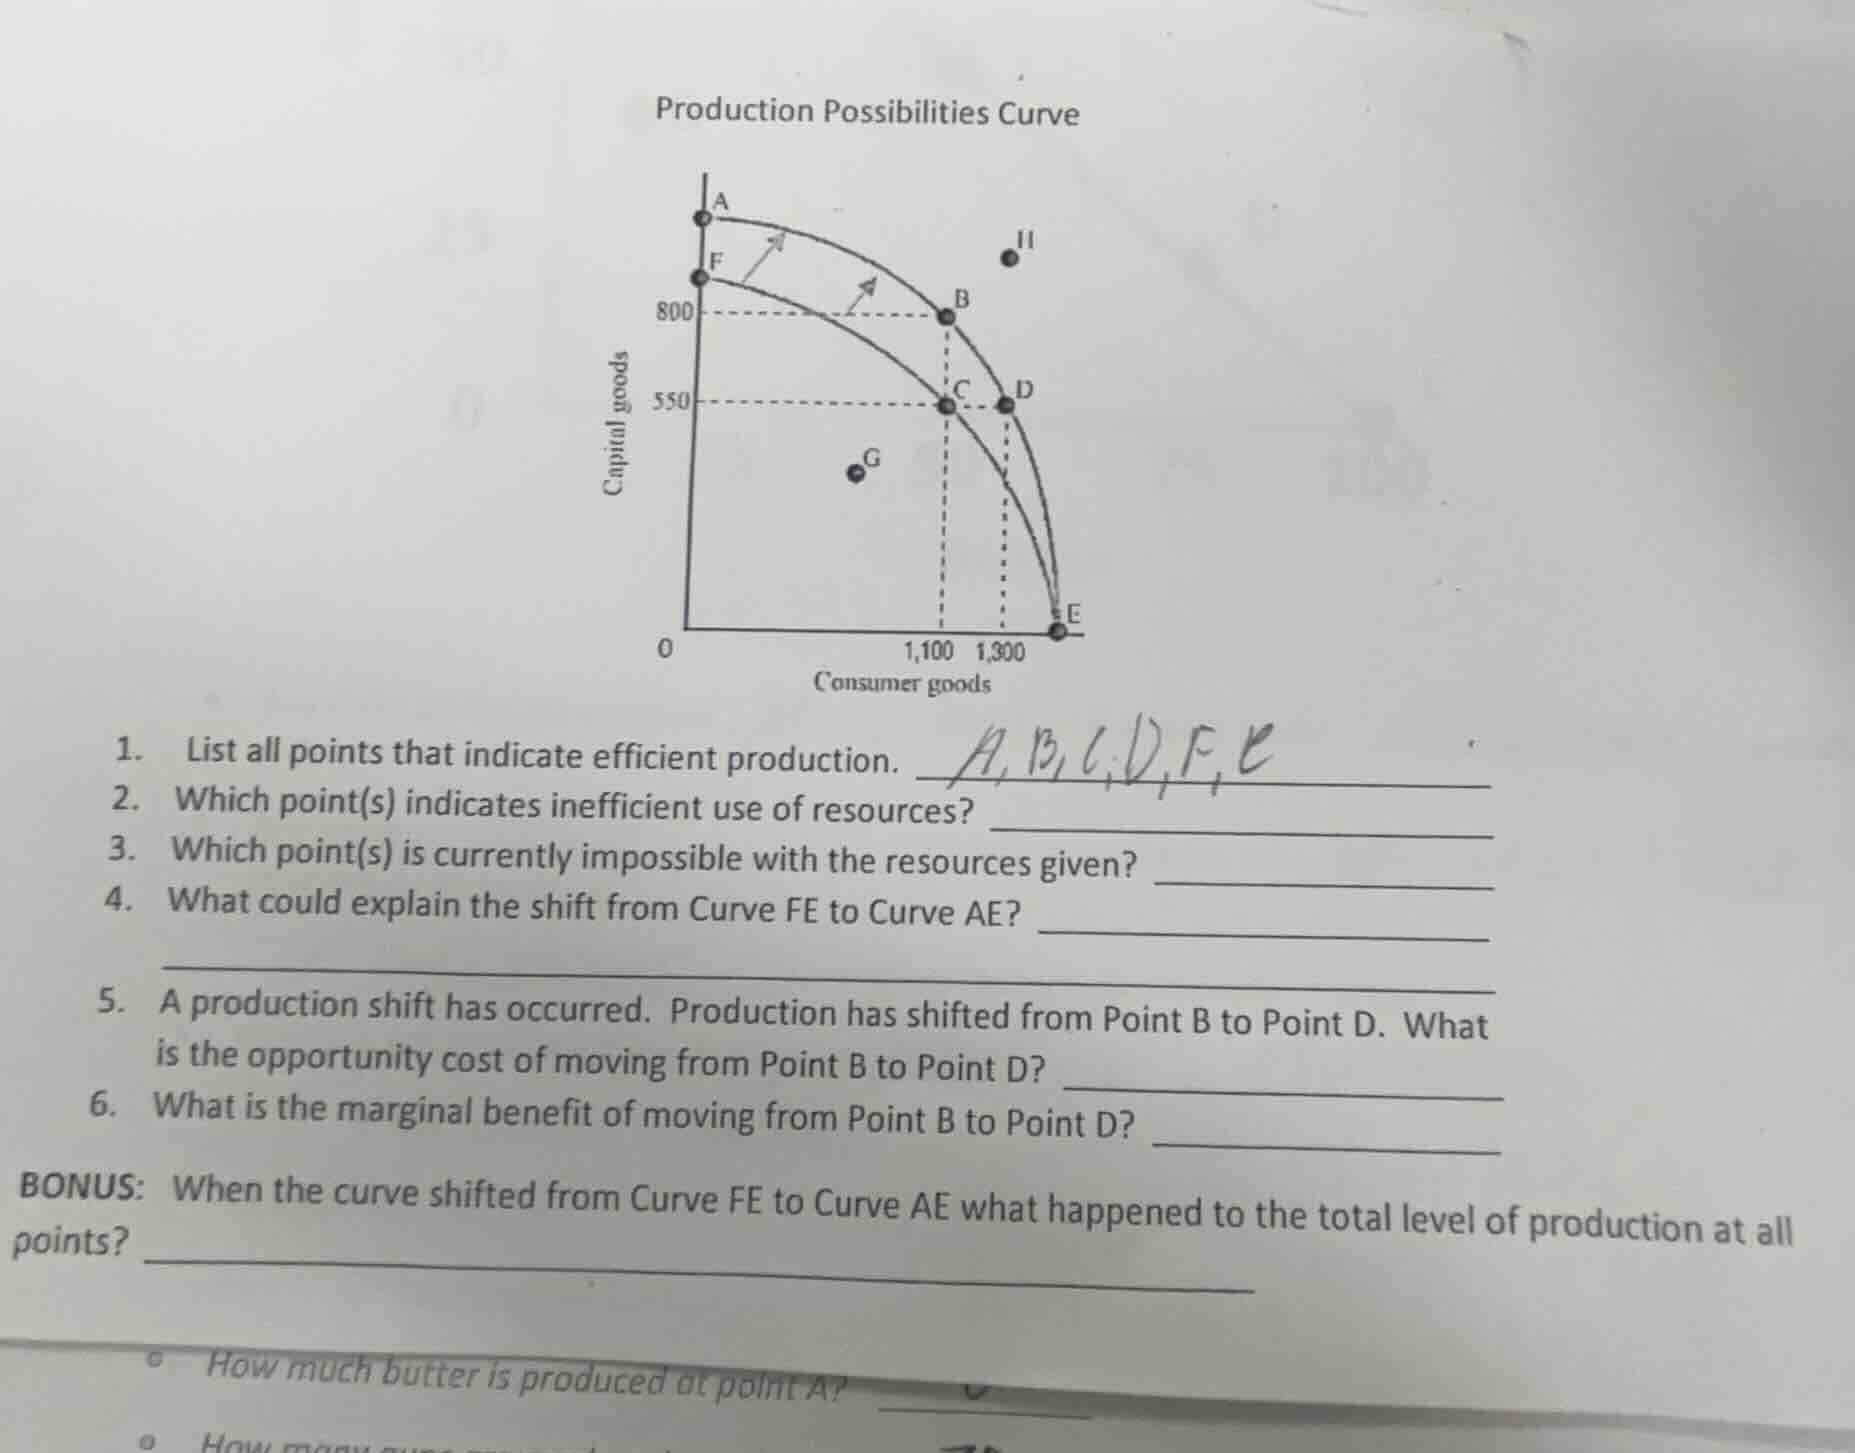
production possibilities curve
- list all points that indicate efficient production.
- which point(s) indicates inefficient use of resources?
- which point(s) is currently impossible with the resources given?
- what could explain the shift from curve fe to curve ae?
- a production shift has occurred. production has shifted from point b to point d. what is the opportunity cost of moving from point b to point d?
- what is the marginal benefit of moving from point b to point d?
bonus: when the curve shifted from curve fe to curve ae what happened to the total level of production at all points?
how much butter is produced at point a?
Brief Explanations
- Efficient production points lie on the production possibilities curve (both curves here).
- Inefficient points are inside the curve, where resources are underutilized.
- Impossible points are outside the current production possibilities curve.
- Outward shifts of the PPC come from increases in resources, technology, or productivity.
- Opportunity cost is the lost capital goods when moving between points.
- Marginal benefit is the gained consumer goods from the move.
- An outward PPC shift increases maximum production at all points.

Snap & solve any problem in the app
Get step-by-step solutions on Sovi AI
Photo-based solutions with guided steps
Explore more problems and detailed explanations
- A, B, D, E, F, C
- G
- II
- An increase in resources, technological advancement, or improved productivity (any valid factor that expands production capacity)
- 250 capital goods (800 - 550)
- 200 consumer goods (1300 - 1100)
- The total level of production (maximum possible output of both goods) increased at all points.