QUESTION IMAGE
Question
q3 - accelerated mathematics gr 8 | lesson: solving and graphing linear inequalities in one-variable
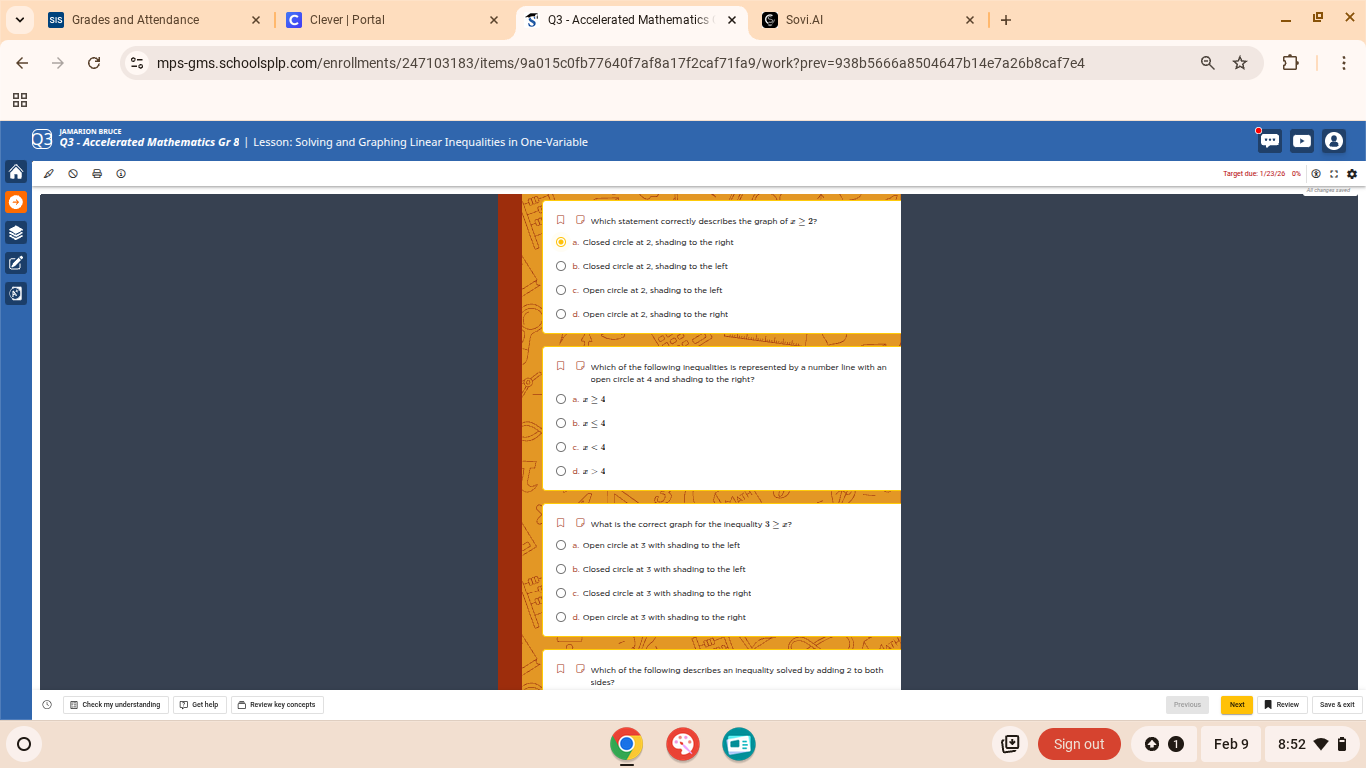
- which statement correctly describes the graph of $x \geq 2$
a. closed circle at 2, shading to the right
b. closed circle at 2, shading to the left
c. open circle at 2, shading to the left
d. open circle at 2, shading to the right
- which of the following inequalities is represented by a number line with an open circle at 4 and shading to the right?
a. $x \geq 4$
b. $x \leq 4$
c. $x < 4$
d. $x > 4$
- what is the correct graph for the inequality $3 \geq x$
a. open circle at 3 with shading to the left
b. closed circle at 3 with shading to the left
c. closed circle at 3 with shading to the right
d. open circle at 3 with shading to the right
- which of the following describes an inequality solved by adding 2 to both sides?
Step1: Analyze $x \geq 2$ graph rules
For $\geq$, use closed circle at 2; values greater than 2 are to the right, so shade right.
Step2: Analyze open circle at 4, shade right
Open circle means $>$ or $<$, shade right means values greater than 4, so inequality is $x > 4$.
Step3: Rewrite $3 \geq x$ as $x \leq 3$
For $\leq$, use closed circle at 3; values less than 3 are to the left, so shade left.

Snap & solve any problem in the app
Get step-by-step solutions on Sovi AI
Photo-based solutions with guided steps
Explore more problems and detailed explanations
- a. Closed circle at 2, shading to the right
- d. $x > 4$
- b. Closed circle at 3 with shading to the left