QUESTION IMAGE
Question
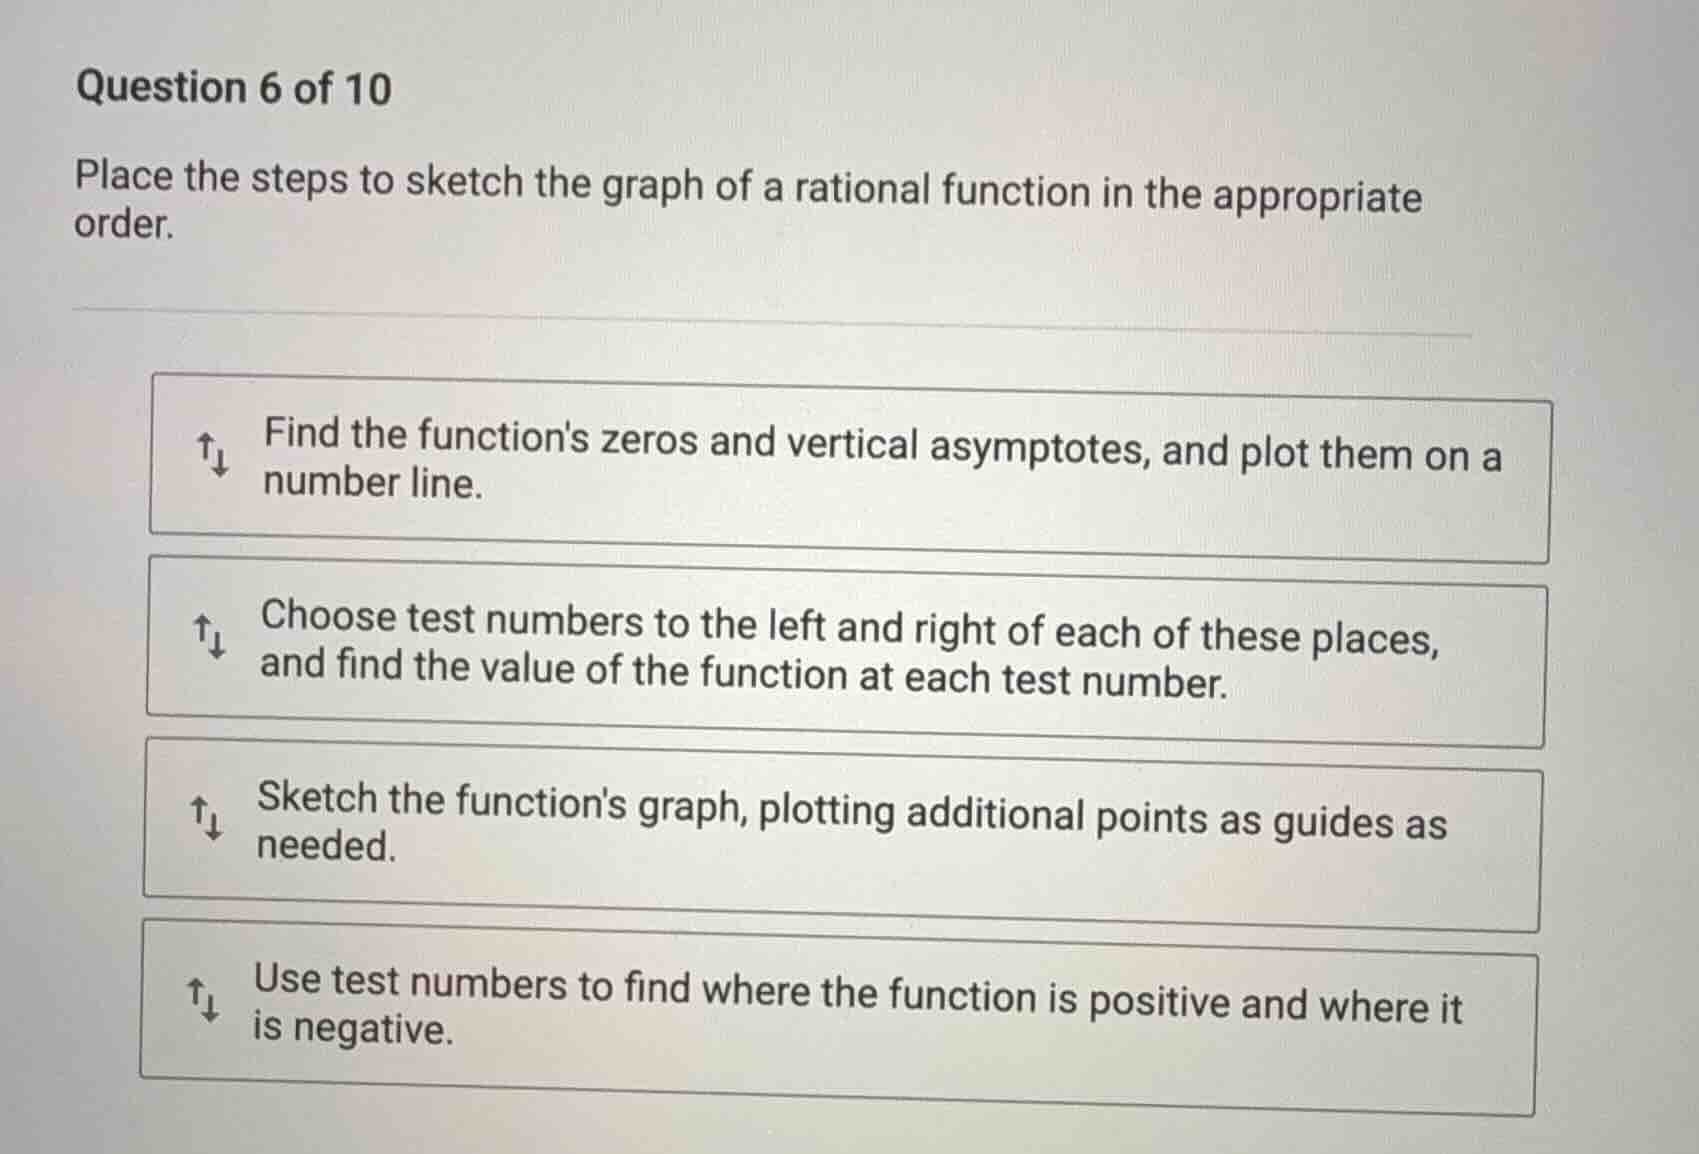
question 6 of 10
place the steps to sketch the graph of a rational function in the appropriate
order.
find the functions zeros and vertical asymptotes, and plot them on a
number line.
choose test numbers to the left and right of each of these places,
and find the value of the function at each test number.
sketch the functions graph, plotting additional points as guides as
needed.
use test numbers to find where the function is positive and where it
is negative.
Step1: Identify the first step
To sketch a rational function's graph, the first step is to find the zeros (x - intercepts) and vertical asymptotes, as these are key features that divide the number line. So the first step is: "Find the function's zeros and vertical asymptotes, and plot them on a number line."
Step2: Identify the second step
After plotting zeros and vertical asymptotes, we choose test numbers around these points (left and right) to analyze the function's behavior. So the second step is: "Choose test numbers to the left and right of each of these places, and find the value of the function at each test number."
Step3: Identify the third step
Using the test numbers, we determine where the function is positive or negative (its sign behavior), which helps in knowing the graph's direction in each interval. So the third step is: "Use test numbers to find where the function is positive and where it is negative."
Step4: Identify the fourth step
Finally, with the information about zeros, asymptotes, and sign behavior, we sketch the graph, adding more points if needed for accuracy. So the fourth step is: "Sketch the function's graph, plotting additional points as guides as needed."

Snap & solve any problem in the app
Get step-by-step solutions on Sovi AI
Photo-based solutions with guided steps
Explore more problems and detailed explanations
- Find the function's zeros and vertical asymptotes, and plot them on a number line.
- Choose test numbers to the left and right of each of these places, and find the value of the function at each test number.
- Use test numbers to find where the function is positive and where it is negative.
- Sketch the function's graph, plotting additional points as guides as needed.