QUESTION IMAGE
Question
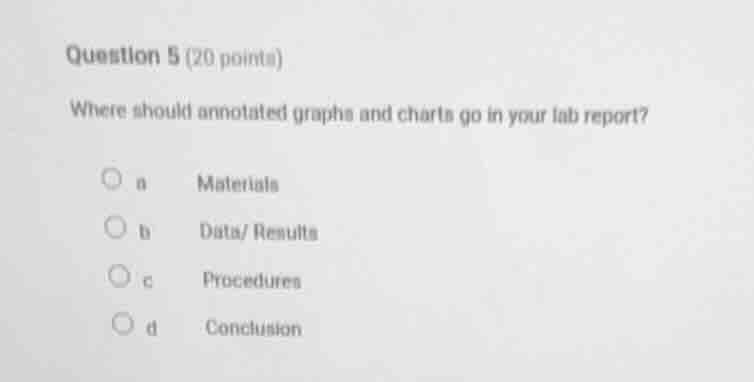
question 5 (20 points)
where should annotated graphs and charts go in your lab report?
a materials
b data/ results
c procedures
d conclusion
Brief Explanations
In a lab report, the "Data/Results" section is where findings, including annotated graphs and charts that present experimental data, are typically placed. "Materials" lists equipment, "Procedures" describes methods, and "Conclusion" summarizes findings, so they don't fit for graphs/charts.

Snap & solve any problem in the app
Get step-by-step solutions on Sovi AI
Photo-based solutions with guided steps
Explore more problems and detailed explanations
b. Data/ Results