QUESTION IMAGE
Question
question 1
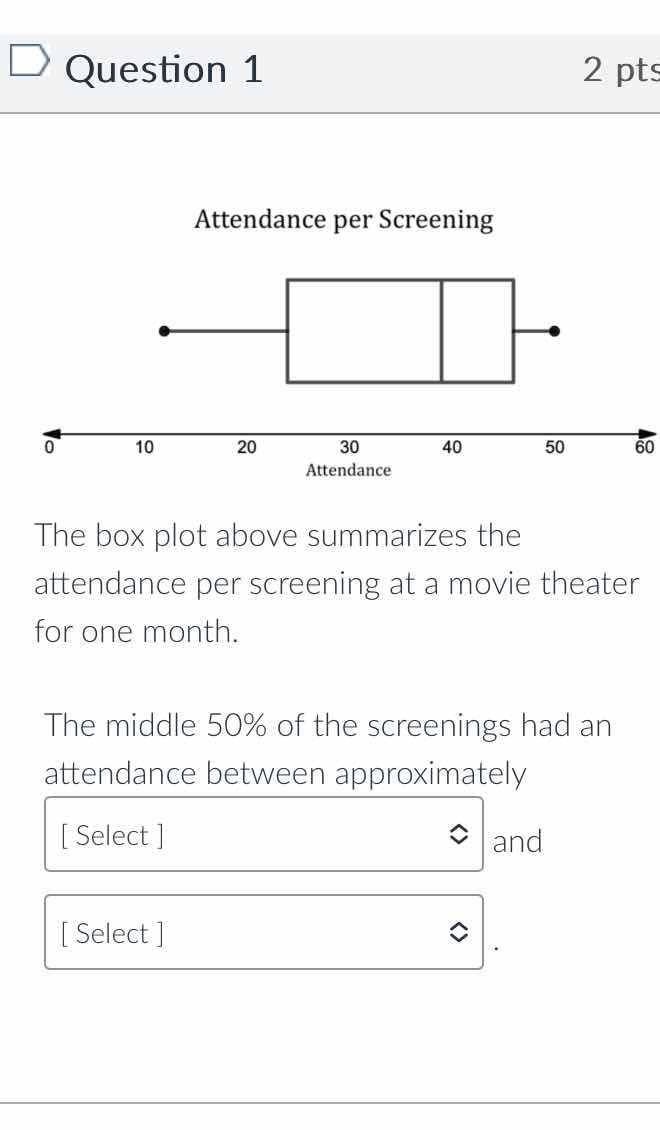
attendance per screening
the box plot above summarizes the attendance per screening at a movie theater for one month.
the middle 50% of the screenings had an attendance between approximately select and select .
Step1: Identify box plot quartiles
In a box plot, the left edge of the box is the first quartile ($Q_1$), representing the 25th percentile, and the right edge is the third quartile ($Q_3$), representing the 75th percentile. The middle 50% of data lies between $Q_1$ and $Q_3$.
Step2: Read values from the plot
From the box plot, the left edge of the box aligns with 20, and the right edge aligns with 45.

Snap & solve any problem in the app
Get step-by-step solutions on Sovi AI
Photo-based solutions with guided steps
Explore more problems and detailed explanations
20 and 45