QUESTION IMAGE
Question
question
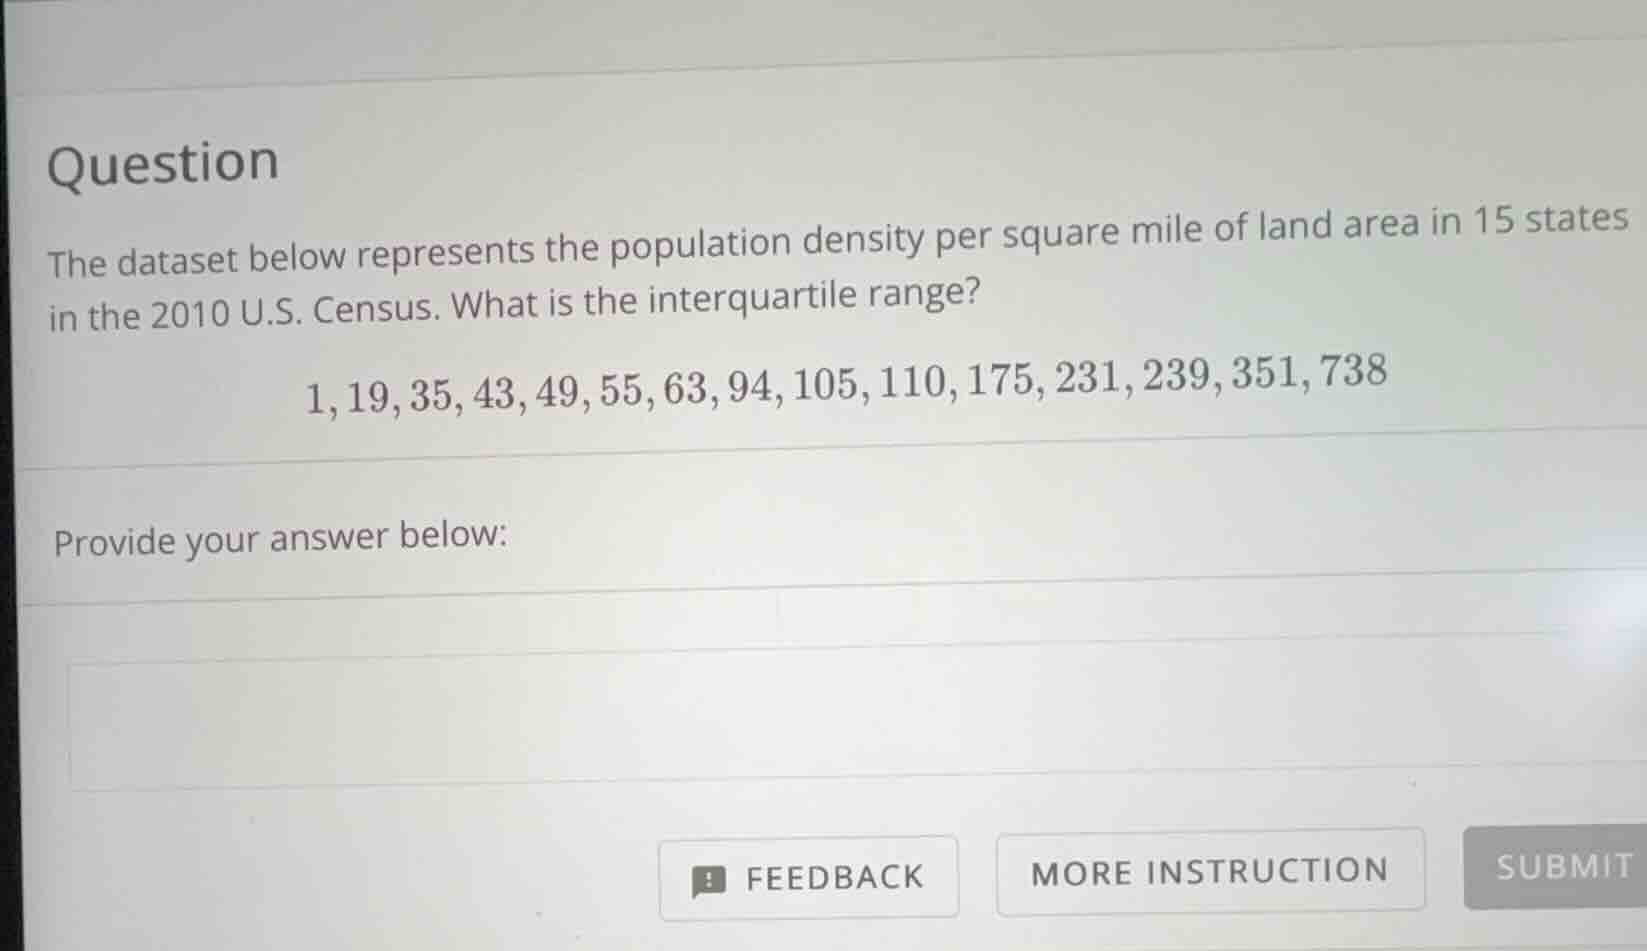
the dataset below represents the population density per square mile of land area in 15 states in the 2010 u.s. census. what is the interquartile range?
1, 19, 35, 43, 49, 55, 63, 94, 105, 110, 175, 231, 239, 351, 738
provide your answer below:
Step1: Find the median (Q2)
The dataset has 15 values, so the median is the 8th value (since \( (15 + 1)/2 = 8 \)). The 8th value is 94. So the dataset is split into lower half: \( 1, 19, 35, 43, 49, 55, 63 \) and upper half: \( 105, 110, 175, 231, 239, 351, 738 \).
Step2: Find Q1 (median of lower half)
The lower half has 7 values, so the median (Q1) is the 4th value (since \( (7 + 1)/2 = 4 \)). The 4th value in \( 1, 19, 35, 43, 49, 55, 63 \) is 43.
Step3: Find Q3 (median of upper half)
The upper half has 7 values, so the median (Q3) is the 4th value (since \( (7 + 1)/2 = 4 \)). The 4th value in \( 105, 110, 175, 231, 239, 351, 738 \) is 231.
Step4: Calculate interquartile range (IQR)
IQR is \( Q3 - Q1 \), so \( 231 - 43 = 188 \).

Snap & solve any problem in the app
Get step-by-step solutions on Sovi AI
Photo-based solutions with guided steps
Explore more problems and detailed explanations
188