QUESTION IMAGE
Question
question
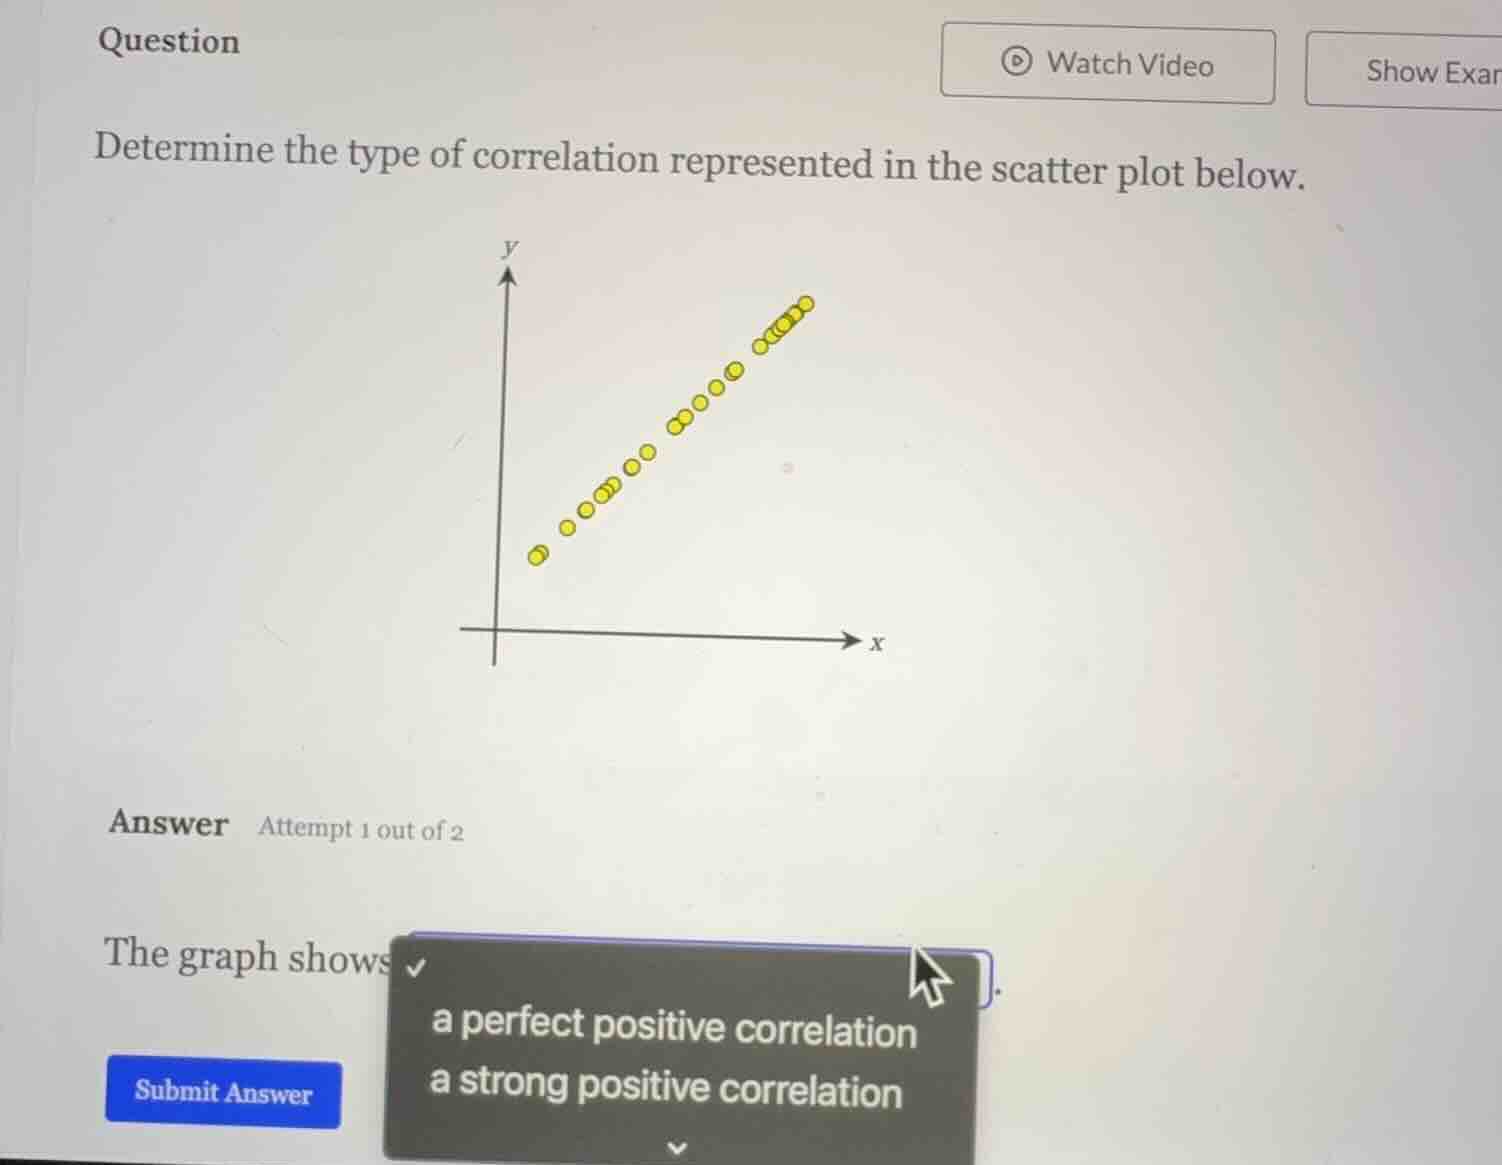
determine the type of correlation represented in the scatter plot below.
scatter plot with yellow points showing a positive trend
answer attempt 1 out of 2
the graph shows dropdown with options: a perfect positive correlation, a strong positive correlation
submit answer
Brief Explanations
The scatter plot has points that closely follow an upward trend, but they do not lie exactly on a single straight line, so it is not a perfect positive correlation. This pattern indicates a strong positive relationship where as x increases, y consistently increases with minimal scatter.

Snap & solve any problem in the app
Get step-by-step solutions on Sovi AI
Photo-based solutions with guided steps
Explore more problems and detailed explanations
a strong positive correlation