QUESTION IMAGE
Question
question
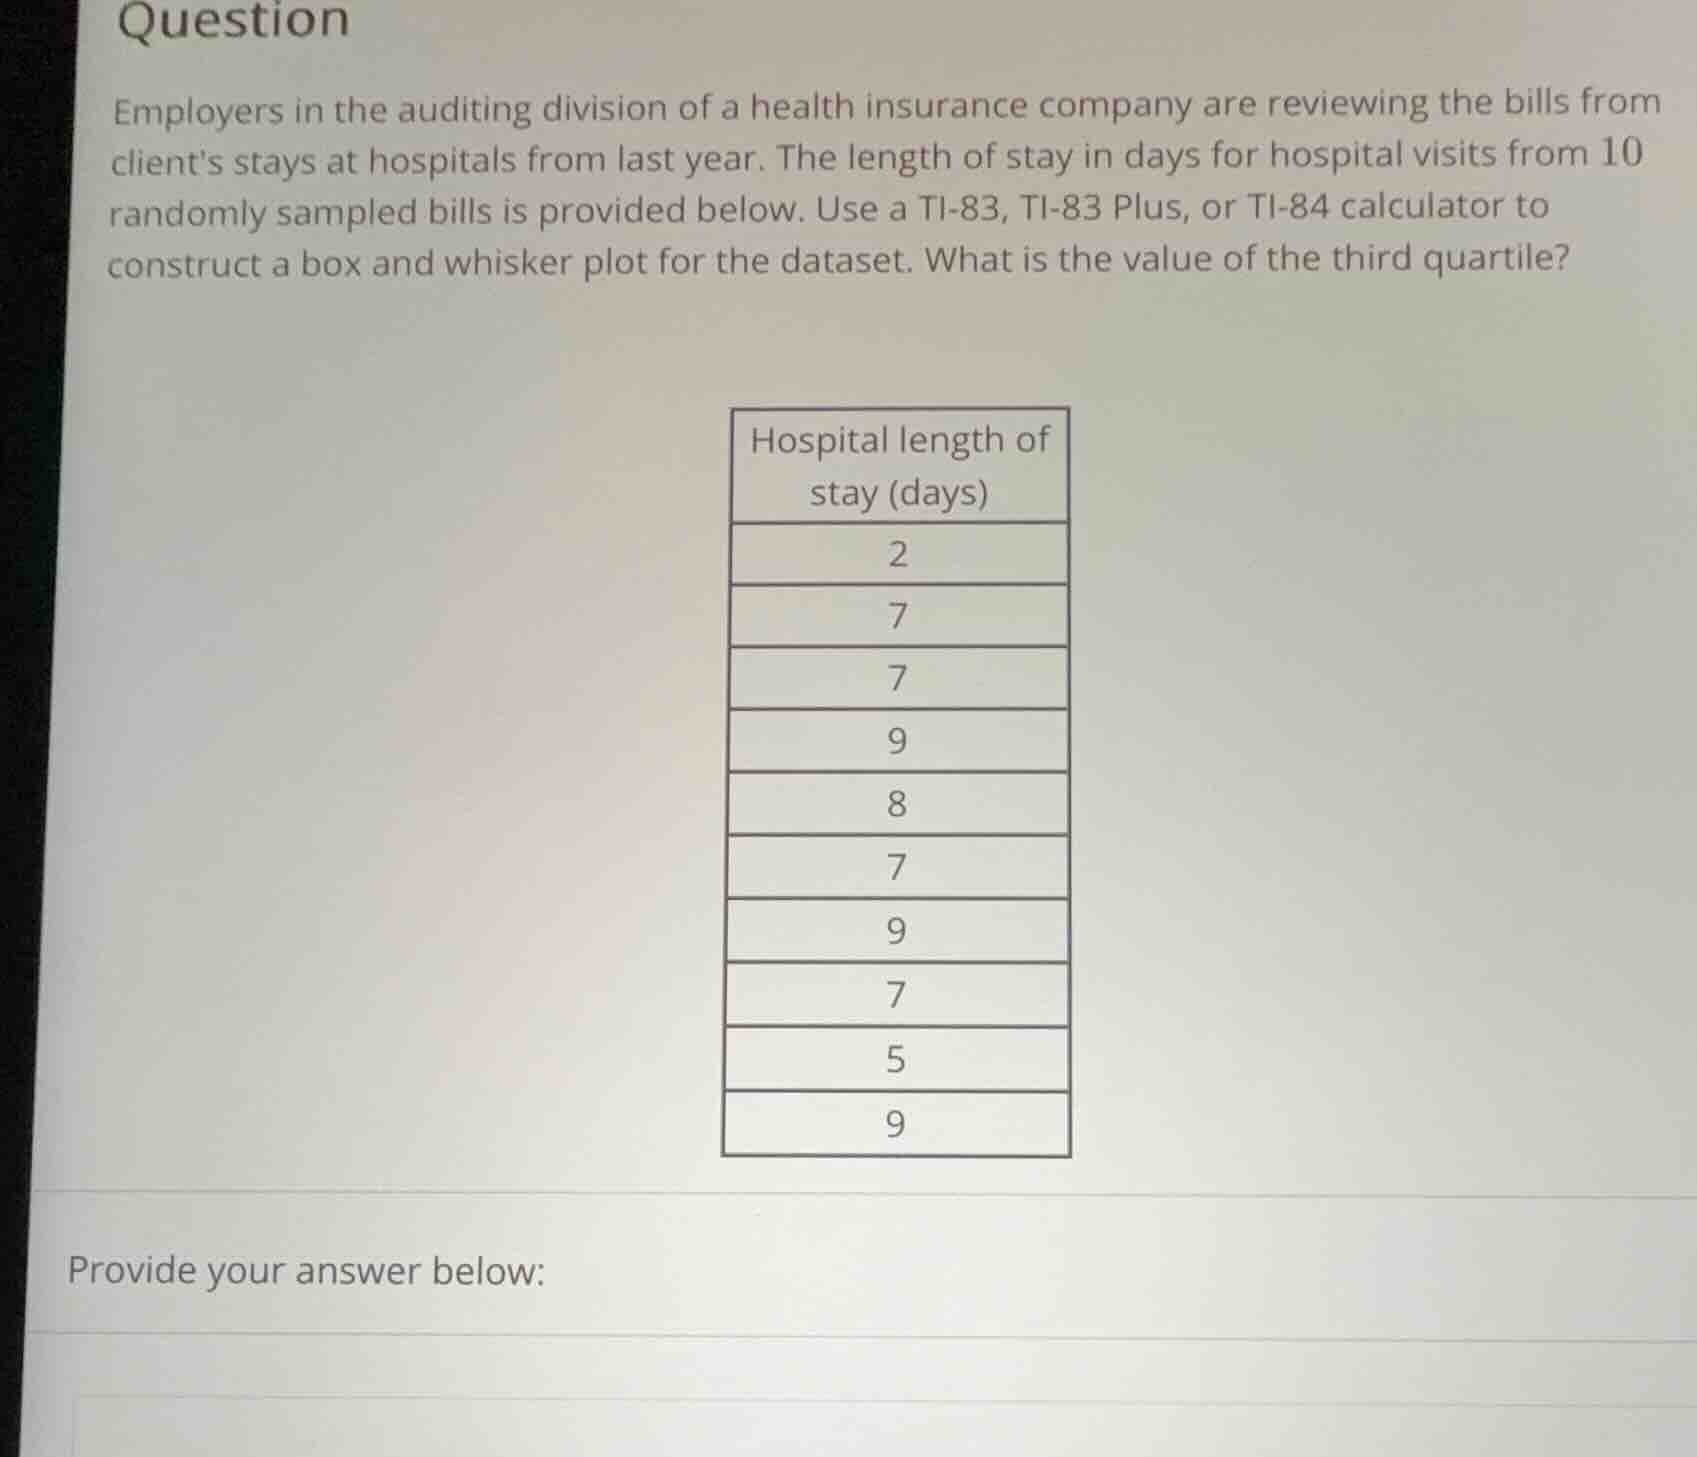
employers in the auditing division of a health insurance company are reviewing the bills from clients stays at hospitals from last year. the length of stay in days for hospital visits from 10 randomly sampled bills is provided below. use a ti-83, ti-83 plus, or ti-84 calculator to construct a box and whisker plot for the dataset. what is the value of the third quartile?
hospital length of
stay (days)
2
7
7
9
8
7
9
7
5
9
provide your answer below:
Step1: Order the dataset
First, we need to order the given dataset from smallest to largest. The dataset is: 2, 5, 7, 7, 7, 7, 8, 9, 9, 9.
Step2: Find the position of the third quartile
For a dataset with \( n = 10 \) observations, the position of the third quartile (\( Q_3 \)) is given by the formula \( \text{Position of } Q_3=\frac{3(n + 1)}{4} \).
Substituting \( n = 10 \) into the formula, we get \( \text{Position of } Q_3=\frac{3(10 + 1)}{4}=\frac{33}{4} = 8.25 \).
Step3: Calculate the third quartile
Since the position is \( 8.25 \), we take the 8th value in the ordered dataset and add 0.25 times the difference between the 9th and 8th values.
The 8th value is 9, the 9th value is 9.
So, \( Q_3=9+0.25\times(9 - 9)=9 \). (Alternatively, using the TI - 83/84 calculator:
- Enter the data into a list (e.g., L1).
- Press
STAT, thenCALC, then1 - Var Stats. - Select the list (e.g., L1) and press
ENTER. - Scroll down to find \( Q_3 \), which will also give the value 9.)

Snap & solve any problem in the app
Get step-by-step solutions on Sovi AI
Photo-based solutions with guided steps
Explore more problems and detailed explanations
9