QUESTION IMAGE
Question
question
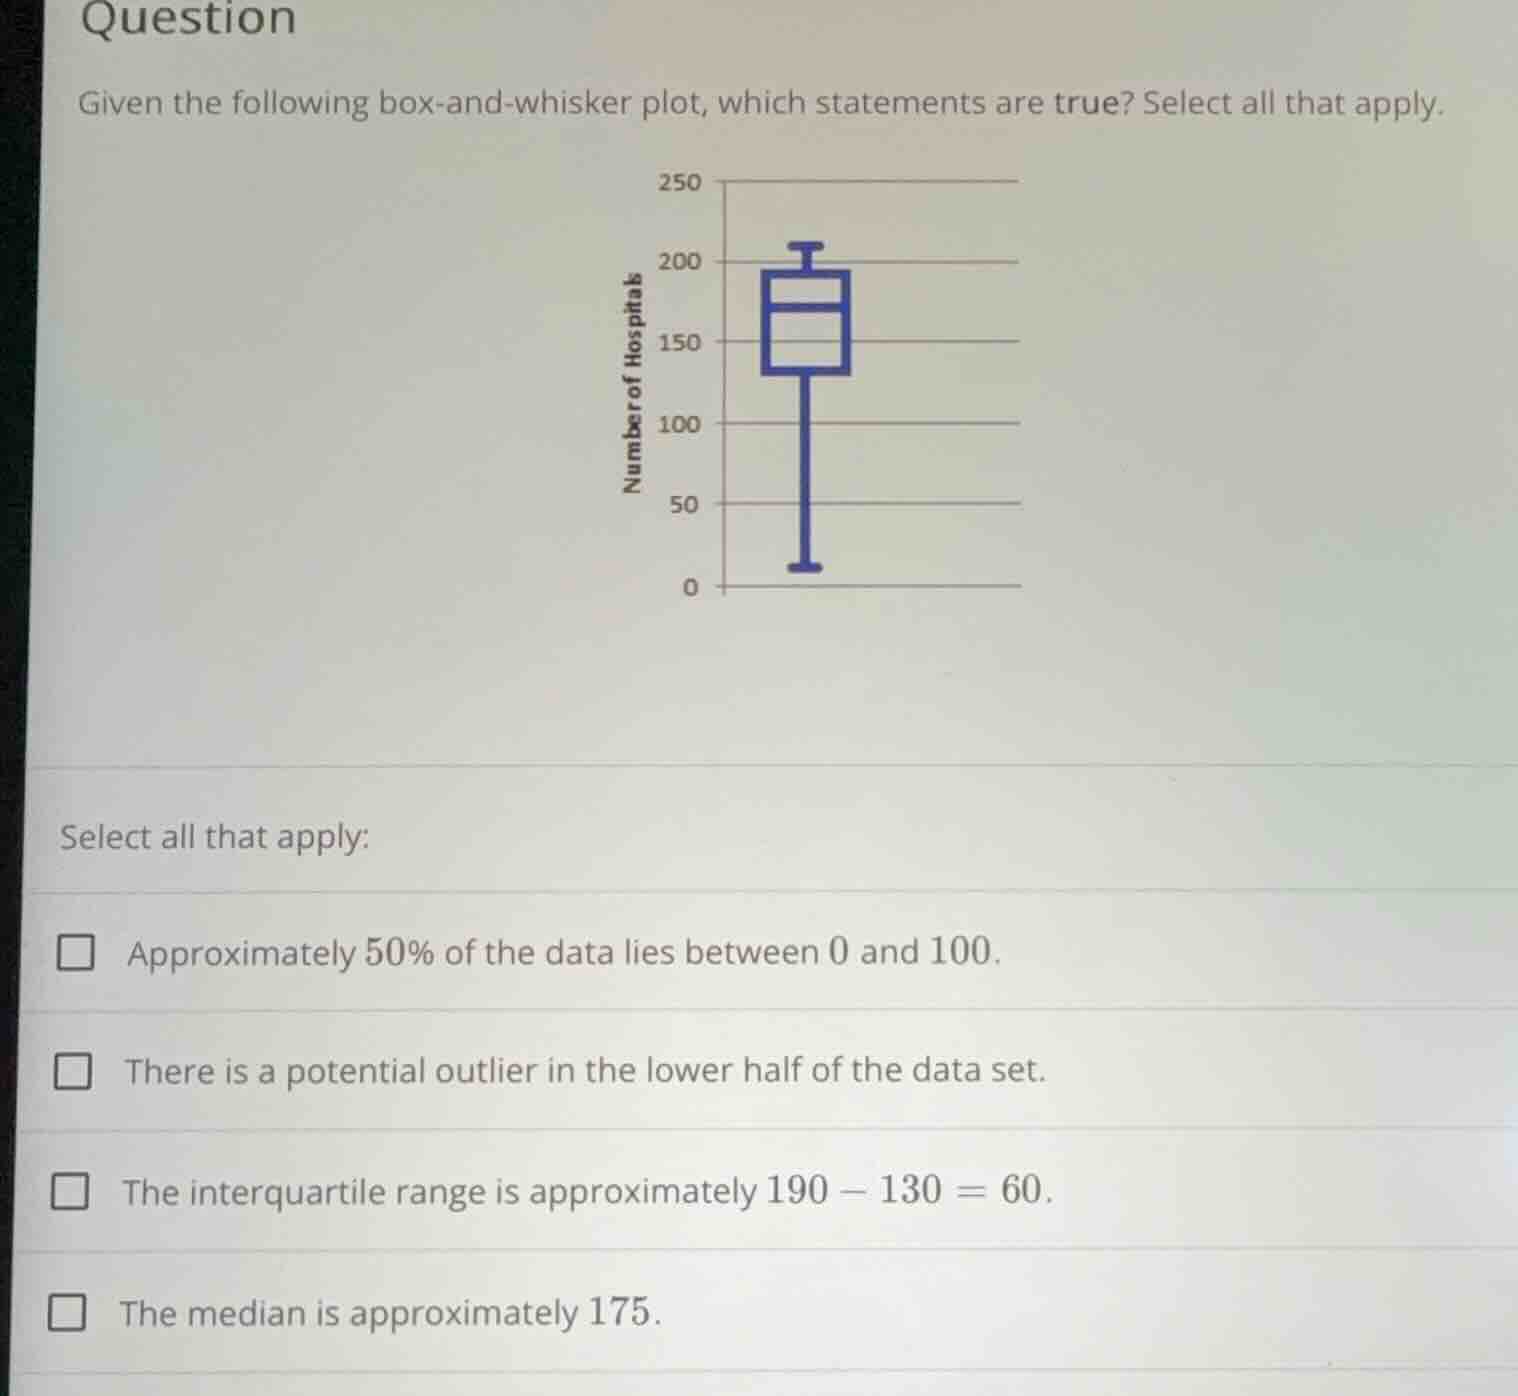
given the following box-and-whisker plot, which statements are true? select all that apply.
select all that apply:
approximately 50% of the data lies between 0 and 100.
there is a potential outlier in the lower half of the data set.
the interquartile range is approximately 190−130=60.
the median is approximately 175.
To solve this, we analyze each statement using box - and - whisker plot concepts (median, quartiles, IQR, outliers).
Step 1: Analyze “Approximately 50% of the data lies between 0 and 100”
In a box - and - whisker plot, the box represents the middle 50% of the data (between \(Q_1\) and \(Q_3\)). The whiskers extend to the minimum and maximum (excluding outliers). The lower whisker here goes to 0, but the middle 50% (inside the box) is between \(Q_1\) and \(Q_3\), not 0 - 100. So this statement is false.
Step 2: Analyze “There is a potential outlier in the lower half of the data set”
Outliers are typically defined as values less than \(Q_1 - 1.5\times IQR\) or greater than \(Q_3+1.5\times IQR\). The lower whisker is at 0, and if the distance from \(Q_1\) to 0 is large (compared to \(1.5\times IQR\)), it could be an outlier. But looking at the plot, the lower whisker is just at 0, and there's no extreme point far from the whisker. However, another way: the lower half (below median) has the minimum at 0, but the box starts around, say, 130? Wait, no, let's re - check. Wait, the box has the median line. Wait, maybe I misread. Wait, the lower whisker is at 0, and the box starts ( \(Q_1\)) maybe around 130? No, the y - axis: 0, 50, 100, 150, 200, 250. The box is from, say, 130 to 190 (since the third statement says \(190 - 130 = 60\) for IQR). The lower whisker is from 0 to \(Q_1\) (130). The length of the lower whisker (0 to 130) is 130, and \(1.5\times IQR=1.5\times60 = 90\). Since \(130>90\), the value 0 is a potential outlier (because \(0 The interquartile range (IQR) is \(Q_3 - Q_1\). In a box - and - whisker plot, the box spans from \(Q_1\) (first quartile) to \(Q_3\) (third quartile). If we estimate \(Q_1\approx130\) and \(Q_3\approx190\), then \(IQR = 190 - 130=60\). This statement is true. The median is the line inside the box. Looking at the box, the median line is around the middle of the box. If \(Q_1\approx130\) and \(Q_3\approx190\), the median (middle of the box) would be around \(\frac{130 + 190}{2}=160\)? Wait, no, the box is from, say, 130 to 190, so the median is the line inside the box. Looking at the y - axis, the box is between 130 and 190, and the median line is around 175? Wait, the y - axis: 150 is a line. The median line is above 150, maybe 175. So this statement could be true? Wait, no, let's re - check the third statement. If \(IQR = 190 - 130 = 60\), then the box is from 130 to 190. The median is the middle of the box, so \(\frac{130 + 190}{2}=160\), but maybe the plot's median line is at 175. Wait, maybe my estimation of \(Q_1\) and \(Q_3\) is wrong. Alternatively, maybe the box is from 150? No, the y - axis has 150 as a horizontal line. The box has a lower part and an upper part. Wait, the first statement: no. Second: the lower whisker is at 0, and \(Q_1\) is, say, 130, \(1.5\times IQR = 90\), \(Q_1-1.5\times IQR=40\), and 0 < 40, so 0 is an outlier. So the second statement: “There is a potential outlier in the lower half” – since 0 is in the lower half (below median) and is an outlier, this is true? Wait, but the third statement: \(190 - 130 =…Step 3: Analyze “The interquartile range is approximately \(190 - 130 = 60\)”
Step 4: Analyze “The median is approximately 175”

Snap & solve any problem in the app
Get step-by-step solutions on Sovi AI
Photo-based solutions with guided steps
Explore more problems and detailed explanations
- There is a potential outlier in the lower half of the data set.
- The interquartile range is approximately \(190 - 130 = 60\).
- The median is approximately 175.