QUESTION IMAGE
Question
question 2
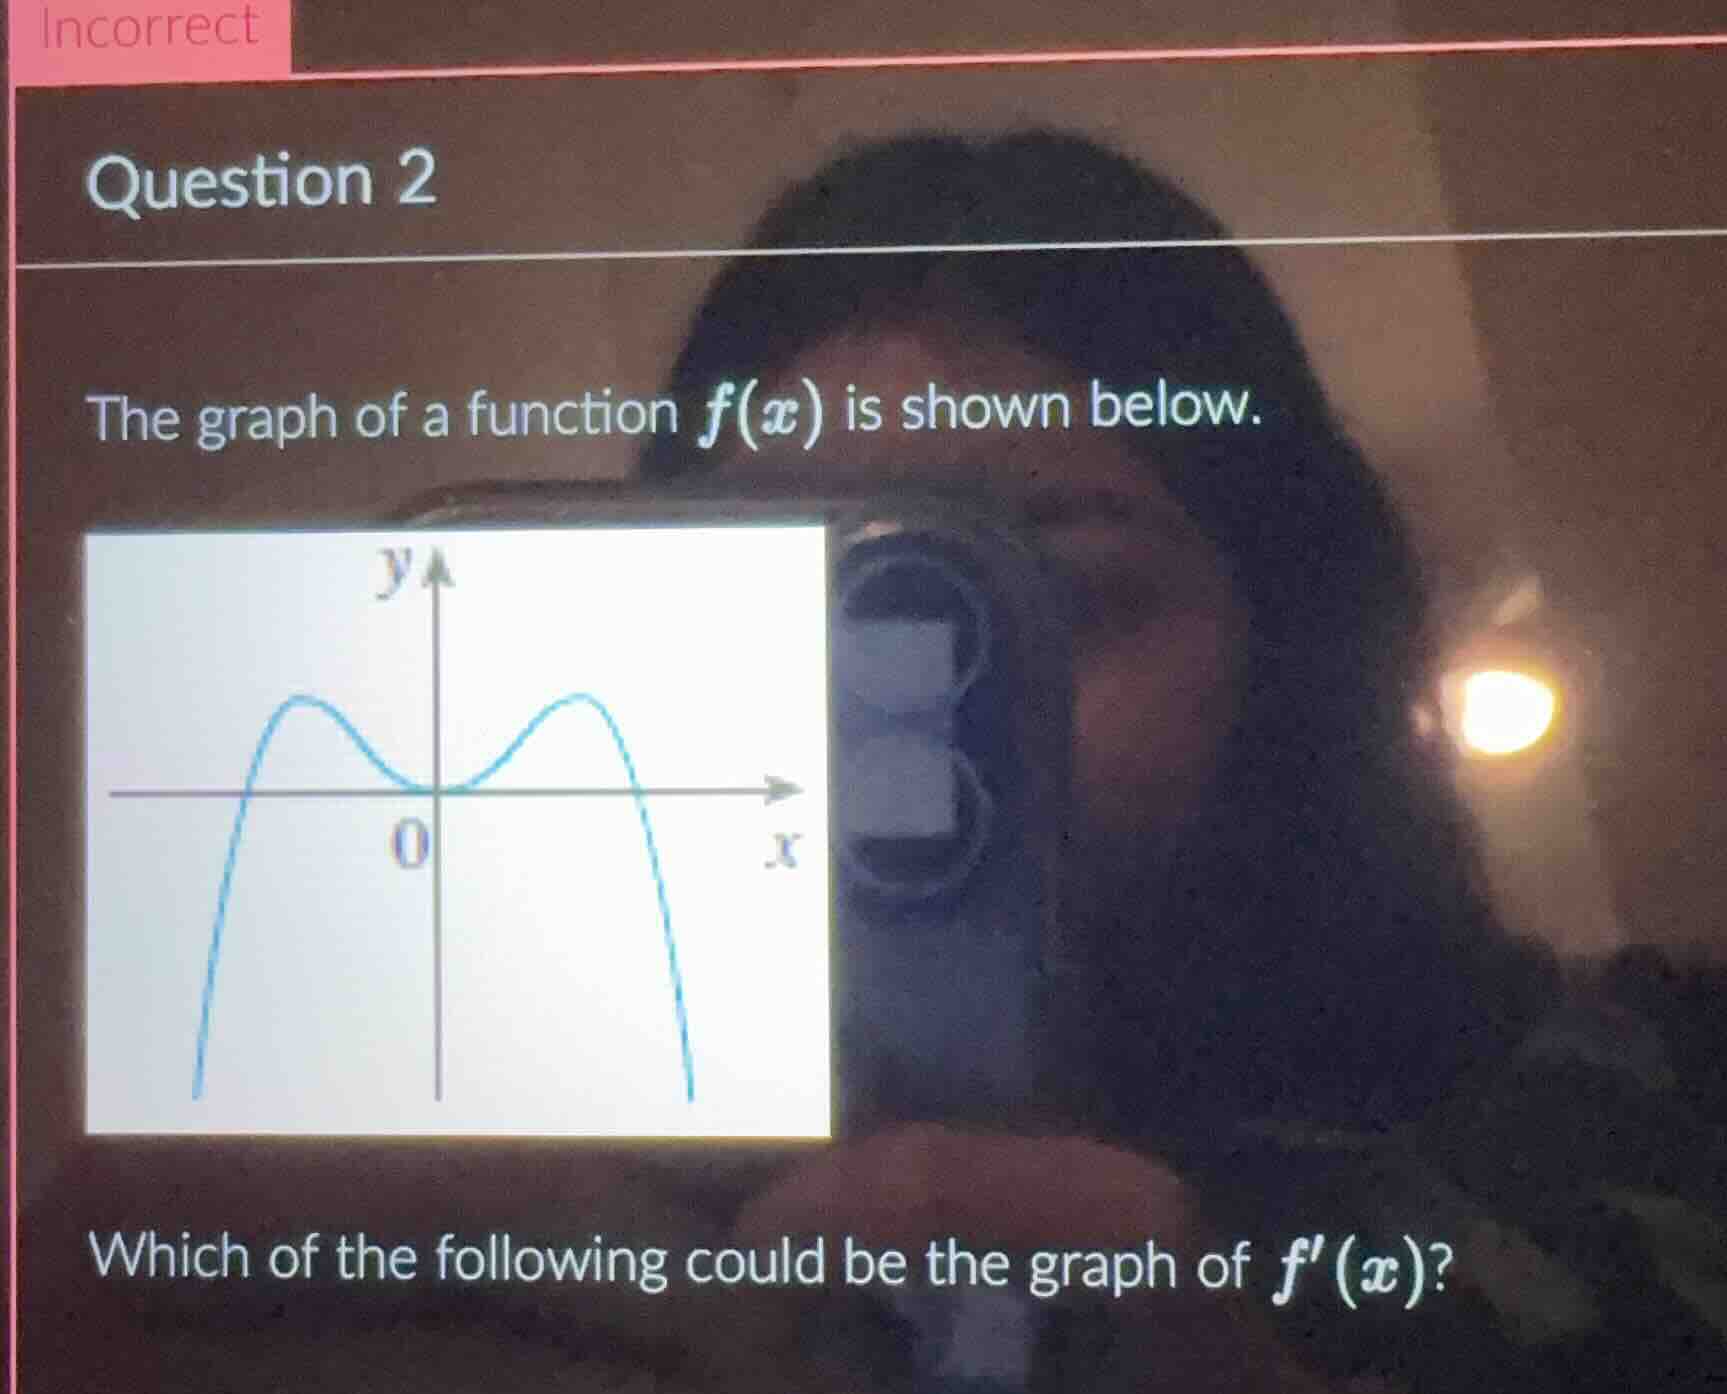
the graph of a function $f(x)$ is shown below.
graph of a function $f(x)$
which of the following could be the graph of $f(x)$?
To determine the graph of \( f'(x) \) from the graph of \( f(x) \), we analyze the slope (derivative) of \( f(x) \) at different points:
Step 1: Analyze Intervals of Increase/Decrease
- Left of the origin (\( x < 0 \)): The graph of \( f(x) \) first increases (slope \( f'(x) > 0 \)), then decreases (slope \( f'(x) < 0 \)).
- At the origin (\( x = 0 \)): The graph of \( f(x) \) has a "valley" (local minimum), so the slope \( f'(x) = 0 \) (horizontal tangent).
- Right of the origin (\( x > 0 \)): The graph of \( f(x) \) first increases (slope \( f'(x) > 0 \)), then decreases (slope \( f'(x) < 0 \)).
Step 2: Shape of \( f'(x) \)
The derivative \( f'(x) \) represents the slope of \( f(x) \). For a function with two "hills" (left and right of the origin) and a valley at \( x = 0 \):
- \( f'(x) \) will be a cubic-like or "W"-shaped (but inverted in sign for decrease)? Wait, no—let’s think again. The left "hill" of \( f(x) \) (left of 0) has a maximum, then a minimum at 0, then a maximum on the right. Wait, actually, the graph of \( f(x) \) shown has:
- Left: A peak (maximum), then a valley at \( x = 0 \), then a peak (maximum) on the right. Wait, no—the graph crosses the x-axis left, rises to a peak, falls to \( x = 0 \) (touching the origin), then rises to another peak, then falls. Wait, the key is:
- When \( f(x) \) is increasing, \( f'(x) > 0 \) (above the x-axis).
- When \( f(x) \) is decreasing, \( f'(x) < 0 \) (below the x-axis).
- At local maxima/minima, \( f'(x) = 0 \) (crosses the x-axis).
Step 3: Key Features of \( f'(x) \)
- The left "hill" of \( f(x) \): Increases ( \( f'(x) > 0 \) ), then decreases ( \( f'(x) < 0 \) ). So \( f'(x) \) on the left will start positive, peak, then become negative, crossing the x-axis at the local maximum of \( f(x) \).
- At \( x = 0 \): \( f(x) \) has a local minimum, so \( f'(x) = 0 \) (crosses the x-axis here).
- The right "hill" of \( f(x) \): Increases ( \( f'(x) > 0 \) ), then decreases ( \( f'(x) < 0 \) ). So \( f'(x) \) on the right will start positive, peak, then become negative, crossing the x-axis at the local maximum of \( f(x) \).
Step 4: Symmetry
The graph of \( f(x) \) is symmetric about the origin (odd function? Wait, no—wait, the left and right halves mirror over the origin? Wait, the graph touches the origin and has symmetric peaks. So \( f(x) \) is even (symmetric about the y-axis)? Wait, no—if it’s symmetric about the origin, it’s odd, but the graph shown has left and right peaks. Wait, regardless, the derivative of an even function is odd, and vice versa. But from the shape, \( f'(x) \) should have:
- A zero at the local maximum of \( f(x) \) (left), a zero at \( x = 0 \) (local minimum of \( f(x) \)), and a zero at the local maximum of \( f(x) \) (right).
- The sign of \( f'(x) \) changes: positive → negative (left of 0), zero at 0, positive → negative (right of 0).
Final Reasoning
The graph of \( f'(x) \) will:
- Cross the x-axis at three points: the local maximum of \( f(x) \) (left), \( x = 0 \) (local minimum of \( f(x) \)), and the local maximum of \( f(x) \) (right).
- Be positive when \( f(x) \) is increasing, negative when \( f(x) \) is decreasing.
Thus, \( f'(x) \) will resemble a "W" or "M"-shaped graph (depending on direction) that crosses the x-axis three times, with positive slopes in the middle of each "hill" of \( f(x) \) and negative slopes at the ends.
(Note: Since the answer choices are not provided, the key is to identify the graph of \( f'(x) \) with three x-intercepts, posit…

Snap & solve any problem in the app
Get step-by-step solutions on Sovi AI
Photo-based solutions with guided steps
Explore more problems and detailed explanations
To determine the graph of \( f'(x) \) from the graph of \( f(x) \), we analyze the slope (derivative) of \( f(x) \) at different points:
Step 1: Analyze Intervals of Increase/Decrease
- Left of the origin (\( x < 0 \)): The graph of \( f(x) \) first increases (slope \( f'(x) > 0 \)), then decreases (slope \( f'(x) < 0 \)).
- At the origin (\( x = 0 \)): The graph of \( f(x) \) has a "valley" (local minimum), so the slope \( f'(x) = 0 \) (horizontal tangent).
- Right of the origin (\( x > 0 \)): The graph of \( f(x) \) first increases (slope \( f'(x) > 0 \)), then decreases (slope \( f'(x) < 0 \)).
Step 2: Shape of \( f'(x) \)
The derivative \( f'(x) \) represents the slope of \( f(x) \). For a function with two "hills" (left and right of the origin) and a valley at \( x = 0 \):
- \( f'(x) \) will be a cubic-like or "W"-shaped (but inverted in sign for decrease)? Wait, no—let’s think again. The left "hill" of \( f(x) \) (left of 0) has a maximum, then a minimum at 0, then a maximum on the right. Wait, actually, the graph of \( f(x) \) shown has:
- Left: A peak (maximum), then a valley at \( x = 0 \), then a peak (maximum) on the right. Wait, no—the graph crosses the x-axis left, rises to a peak, falls to \( x = 0 \) (touching the origin), then rises to another peak, then falls. Wait, the key is:
- When \( f(x) \) is increasing, \( f'(x) > 0 \) (above the x-axis).
- When \( f(x) \) is decreasing, \( f'(x) < 0 \) (below the x-axis).
- At local maxima/minima, \( f'(x) = 0 \) (crosses the x-axis).
Step 3: Key Features of \( f'(x) \)
- The left "hill" of \( f(x) \): Increases ( \( f'(x) > 0 \) ), then decreases ( \( f'(x) < 0 \) ). So \( f'(x) \) on the left will start positive, peak, then become negative, crossing the x-axis at the local maximum of \( f(x) \).
- At \( x = 0 \): \( f(x) \) has a local minimum, so \( f'(x) = 0 \) (crosses the x-axis here).
- The right "hill" of \( f(x) \): Increases ( \( f'(x) > 0 \) ), then decreases ( \( f'(x) < 0 \) ). So \( f'(x) \) on the right will start positive, peak, then become negative, crossing the x-axis at the local maximum of \( f(x) \).
Step 4: Symmetry
The graph of \( f(x) \) is symmetric about the origin (odd function? Wait, no—wait, the left and right halves mirror over the origin? Wait, the graph touches the origin and has symmetric peaks. So \( f(x) \) is even (symmetric about the y-axis)? Wait, no—if it’s symmetric about the origin, it’s odd, but the graph shown has left and right peaks. Wait, regardless, the derivative of an even function is odd, and vice versa. But from the shape, \( f'(x) \) should have:
- A zero at the local maximum of \( f(x) \) (left), a zero at \( x = 0 \) (local minimum of \( f(x) \)), and a zero at the local maximum of \( f(x) \) (right).
- The sign of \( f'(x) \) changes: positive → negative (left of 0), zero at 0, positive → negative (right of 0).
Final Reasoning
The graph of \( f'(x) \) will:
- Cross the x-axis at three points: the local maximum of \( f(x) \) (left), \( x = 0 \) (local minimum of \( f(x) \)), and the local maximum of \( f(x) \) (right).
- Be positive when \( f(x) \) is increasing, negative when \( f(x) \) is decreasing.
Thus, \( f'(x) \) will resemble a "W" or "M"-shaped graph (depending on direction) that crosses the x-axis three times, with positive slopes in the middle of each "hill" of \( f(x) \) and negative slopes at the ends.
(Note: Since the answer choices are not provided, the key is to identify the graph of \( f'(x) \) with three x-intercepts, positive values where \( f(x) \) increases, and negative values where \( f(x) \) decreases.)