QUESTION IMAGE
Question
question 1 of 8
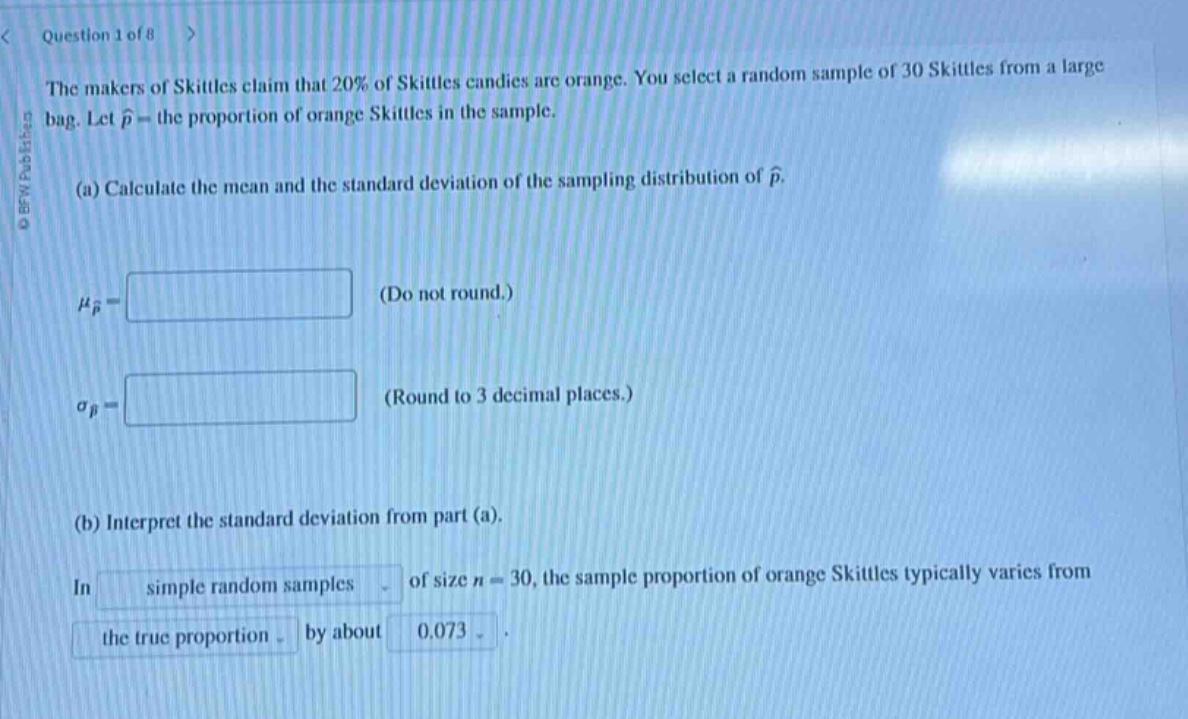
the makers of skittles claim that 20% of skittles candies are orange. you select a random sample of 30 skittles from a large bag. let \\(\hat{p}\\) = the proportion of orange skittles in the sample.
(a) calculate the mean and the standard deviation of the sampling distribution of \\(\hat{p}\\).
\\(\mu_{\hat{p}} = \\) (do not round.)
\\(\sigma_{\hat{p}} = \\) (round to 3 decimal places.)
(b) interpret the standard deviation from part (a).
in simple random samples of size \\(n = 30\\), the sample proportion of orange skittles typically varies from the true proportion by about 0.073.
Part (a)
For the sampling distribution of the sample proportion \(\hat{p}\), we use the following formulas:
- The mean of the sampling distribution of \(\hat{p}\) (denoted as \(\mu_{\hat{p}}\)) is equal to the population proportion \(p\).
- The standard deviation of the sampling distribution of \(\hat{p}\) (denoted as \(\sigma_{\hat{p}}\)) is given by the formula \(\sigma_{\hat{p}}=\sqrt{\frac{p(1 - p)}{n}}\), where \(p\) is the population proportion and \(n\) is the sample size.
Given:
- Population proportion \(p = 0.20\) (since 20% of Skittles are orange)
- Sample size \(n=30\)
Step 1: Calculate the mean \(\mu_{\hat{p}}\)
The mean of the sampling distribution of \(\hat{p}\) is equal to the population proportion \(p\). So,
\(\mu_{\hat{p}}=p = 0.20\)
Step 2: Calculate the standard deviation \(\sigma_{\hat{p}}\)
We use the formula \(\sigma_{\hat{p}}=\sqrt{\frac{p(1 - p)}{n}}\)
Substitute \(p = 0.20\) and \(n = 30\) into the formula:
\[
\]
Part (b)
The standard deviation of the sampling distribution of \(\hat{p}\) (also known as the standard error) tells us about the typical amount of variation we expect to see in the sample proportions \(\hat{p}\) from different samples of the same size. In this case, for simple random samples of size \(n = 30\), the sample proportion of orange Skittles (\(\hat{p}\)) typically varies from the true proportion (\(p = 0.20\)) by about \(0.073\). This means that if we were to take many different samples of 30 Skittles, the proportion of orange Skittles in each sample would typically differ from the actual population proportion (20%) by approximately \(0.073\) (or 7.3 percentage points) on average.

Snap & solve any problem in the app
Get step-by-step solutions on Sovi AI
Photo-based solutions with guided steps
Explore more problems and detailed explanations
s:
Part (a)
- \(\mu_{\hat{p}}=\boldsymbol{0.20}\)
- \(\sigma_{\hat{p}}=\boldsymbol{0.073}\)
Part (b)
In simple random samples of size \(n = 30\), the sample proportion of orange Skittles typically varies from the true proportion by about \(0.073\).