QUESTION IMAGE
Question
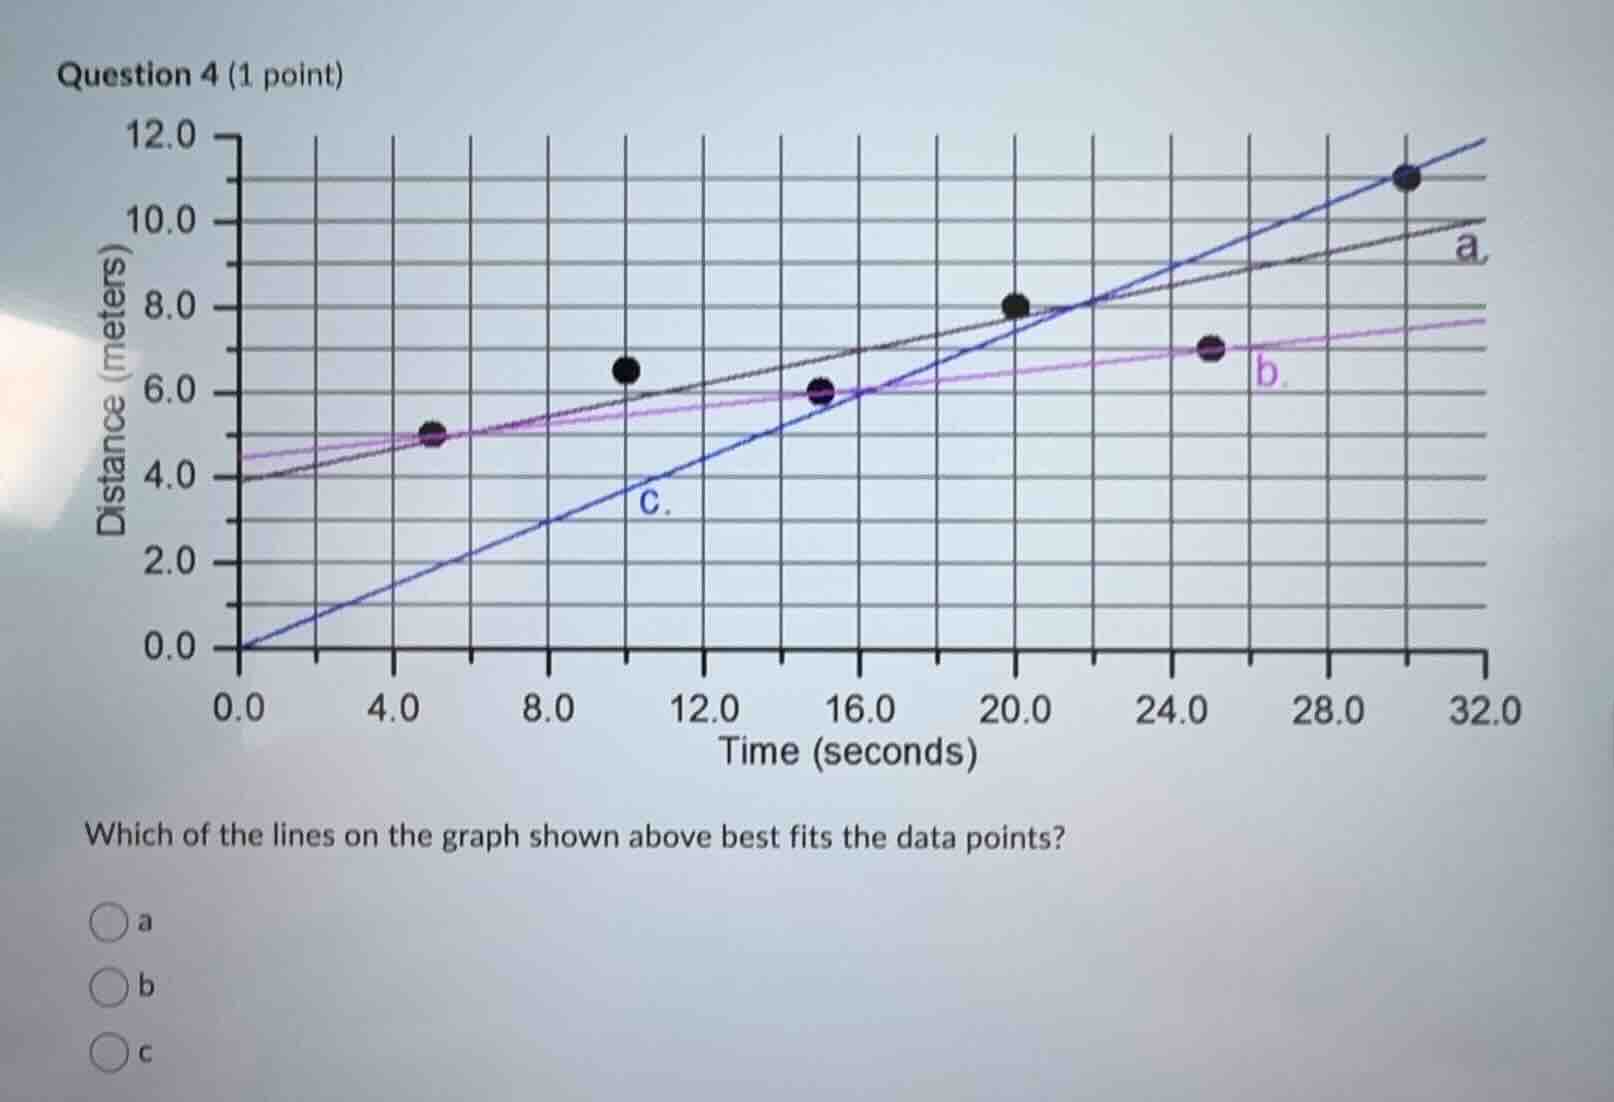
question 4 (1 point)
which of the lines on the graph shown above best fits the data points?
a
b
c
Brief Explanations
To determine the best - fit line, we analyze the position of the data points relative to each line. Line \(a\) passes through or is very close to most of the data points. Line \(b\) is above some points and below others but not as close as line \(a\). Line \(c\) starts at the origin and does not align well with the initial data points (the first few data points are above line \(c\) and the later ones are around it but not as closely as line \(a\)). So, line \(a\) is the best - fit line.

Snap & solve any problem in the app
Get step-by-step solutions on Sovi AI
Photo-based solutions with guided steps
Explore more problems and detailed explanations
a