QUESTION IMAGE
Question
questions 11 and 12 refer to the following.
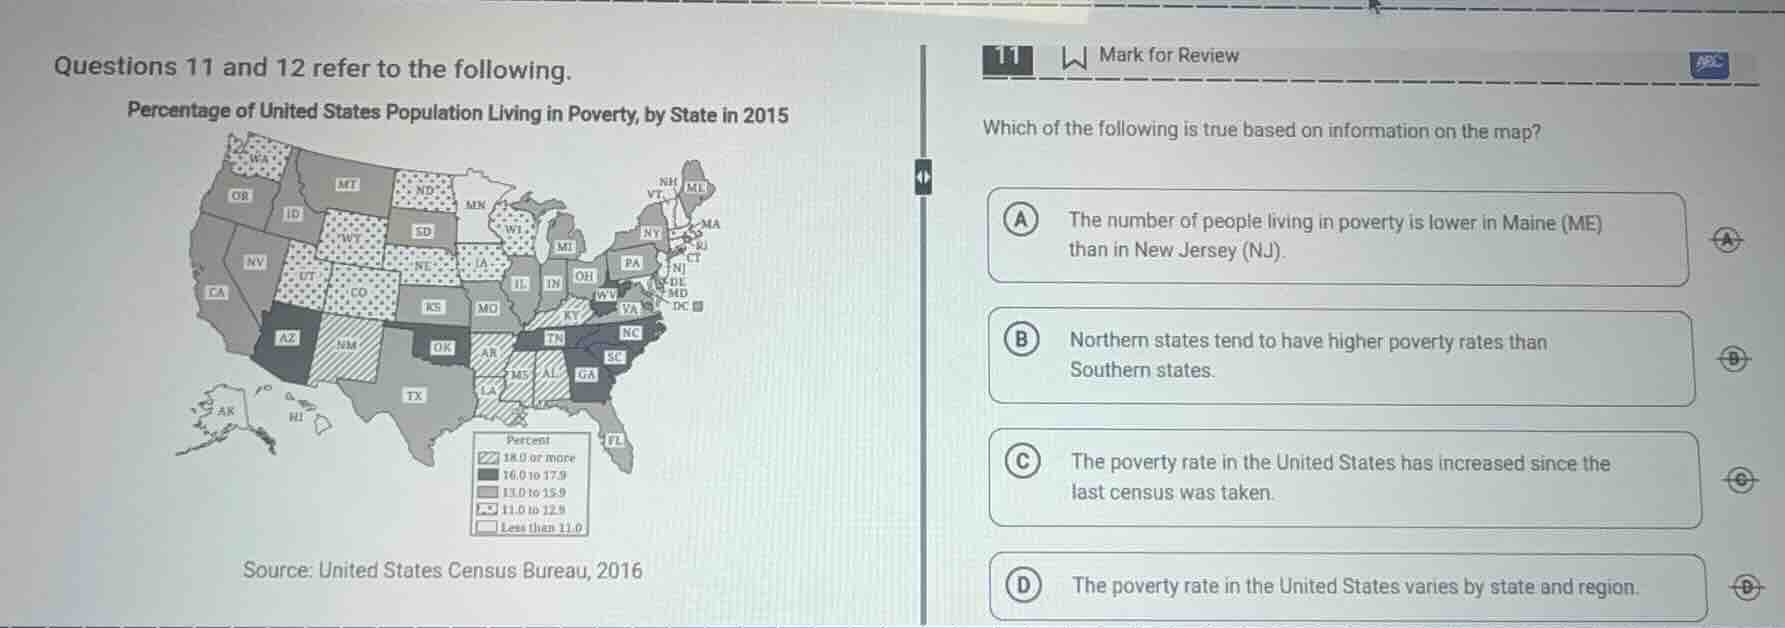
percentage of united states population living in poverty, by state in 2015
source: united states census bureau, 2016
11 mark for review
which of the following is true based on information on the map?
a the number of people living in poverty is lower in maine (me) than in new jersey (nj).
b northern states tend to have higher poverty rates than southern states.
c the poverty rate in the united states has increased since the last census was taken.
d the poverty rate in the united states varies by state and region.
- Option A: The map only shows poverty rates (percentages), not the total number of people in poverty. We cannot compare the total number of poor people between Maine and New Jersey using this data.
- Option B: The map shows most Southern states have higher poverty rates (darker shading) than most Northern states, so this is false.
- Option C: The map only provides data for 2015; there is no information about prior census poverty rates to measure an increase.
- Option D: The map clearly displays different poverty rate categories across various states and regions (e.g., higher rates in the South, lower rates in upper Midwest/Northeast), proving variation by state and region.

Snap & solve any problem in the app
Get step-by-step solutions on Sovi AI
Photo-based solutions with guided steps
Explore more problems and detailed explanations
D. The poverty rate in the United States varies by state and region.