QUESTION IMAGE
Question
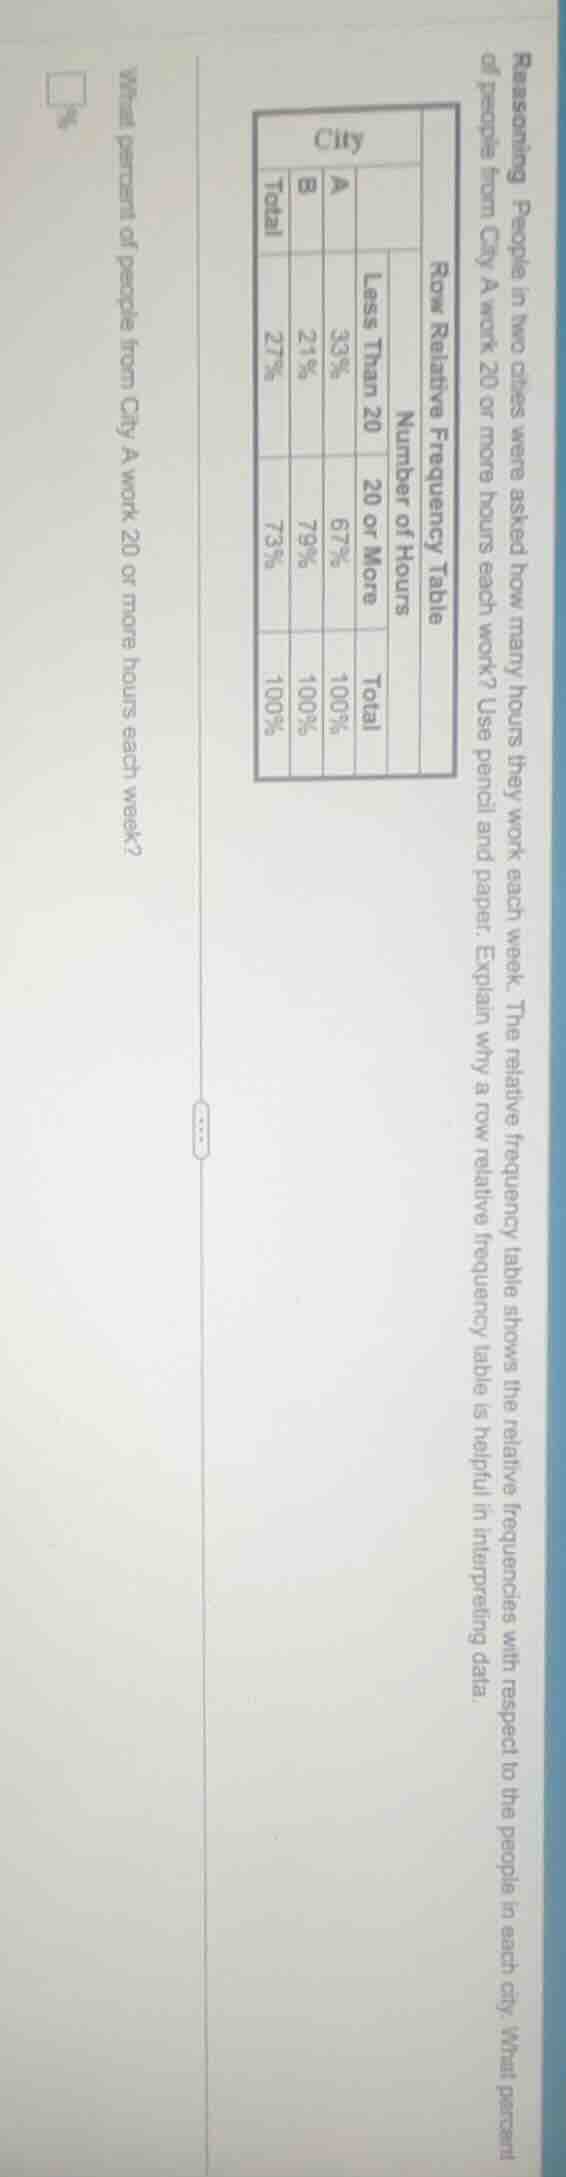
reasoning people in two cities were asked how many hours they work each week. the relative frequency table shows the relative frequencies with respect to the people in each city. what percent of people from city a work 20 or more hours each week? use pencil and paper. explain why a row relative frequency table is helpful in interpreting data. row relative frequency table number of hours less than 20 20 or more total city a 33% 67% 100% city b 21% 79% 100% total 27% 73% 100% what percent of people from city a work 20 or more hours each week? %
Step1: Identify the relevant row and column
We need the percentage of people from City A who work 20 or more hours. Looking at the table, under "City A" and "20 or More" row.
Step2: Read the value
The value in that cell is 67%.

Snap & solve any problem in the app
Get step-by-step solutions on Sovi AI
Photo-based solutions with guided steps
Explore more problems and detailed explanations
67%