QUESTION IMAGE
Question
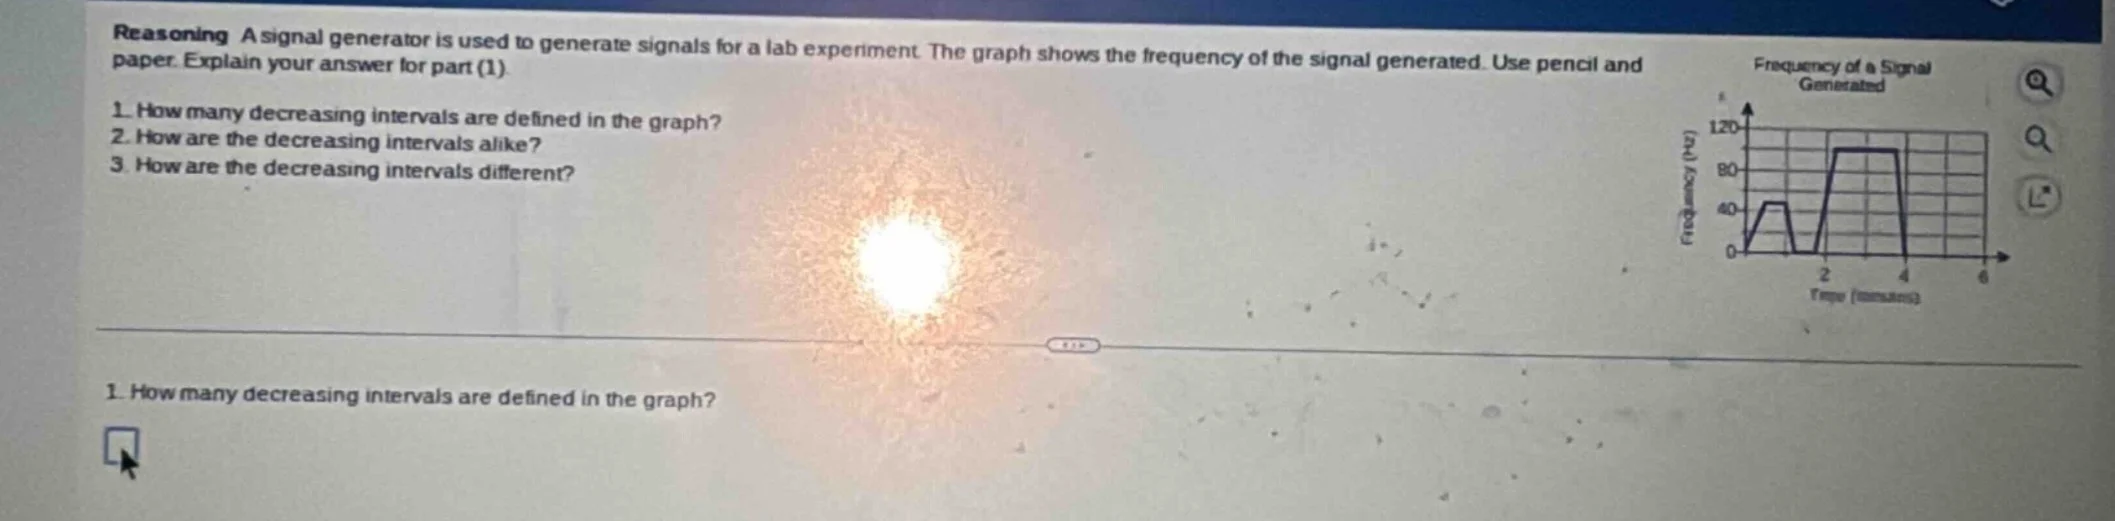
reasoning a signal generator is used to generate signals for a lab experiment. the graph shows the frequency of the signal generated. use pencil and paper. explain your answer for part (1).
- how many decreasing intervals are defined in the graph?
- how are the decreasing intervals alike?
- how are the decreasing intervals different?
- how many decreasing intervals are defined in the graph?
Response
To determine the number of decreasing intervals, we analyze the graph of the signal's frequency over time:
Step 1: Identify intervals where frequency decreases
A "decreasing interval" is a time period where the frequency (y - value) decreases as time (x - value) increases.
- First decreasing interval: After the first peak (around \( x \approx 1 \) minute), the frequency drops to 0 (or a minimum) before \( x = 2 \) minutes.
- Second decreasing interval: After the second peak (around \( x \approx 4 \) minutes), the frequency drops (though the graph cuts off, the visible decrease here counts as a second interval).
Step 2: Count the decreasing intervals
From the graph, we observe two distinct intervals where the frequency decreases as time increases.

Snap & solve any problem in the app
Get step-by-step solutions on Sovi AI
Photo-based solutions with guided steps
Explore more problems and detailed explanations
2