QUESTION IMAGE
Question
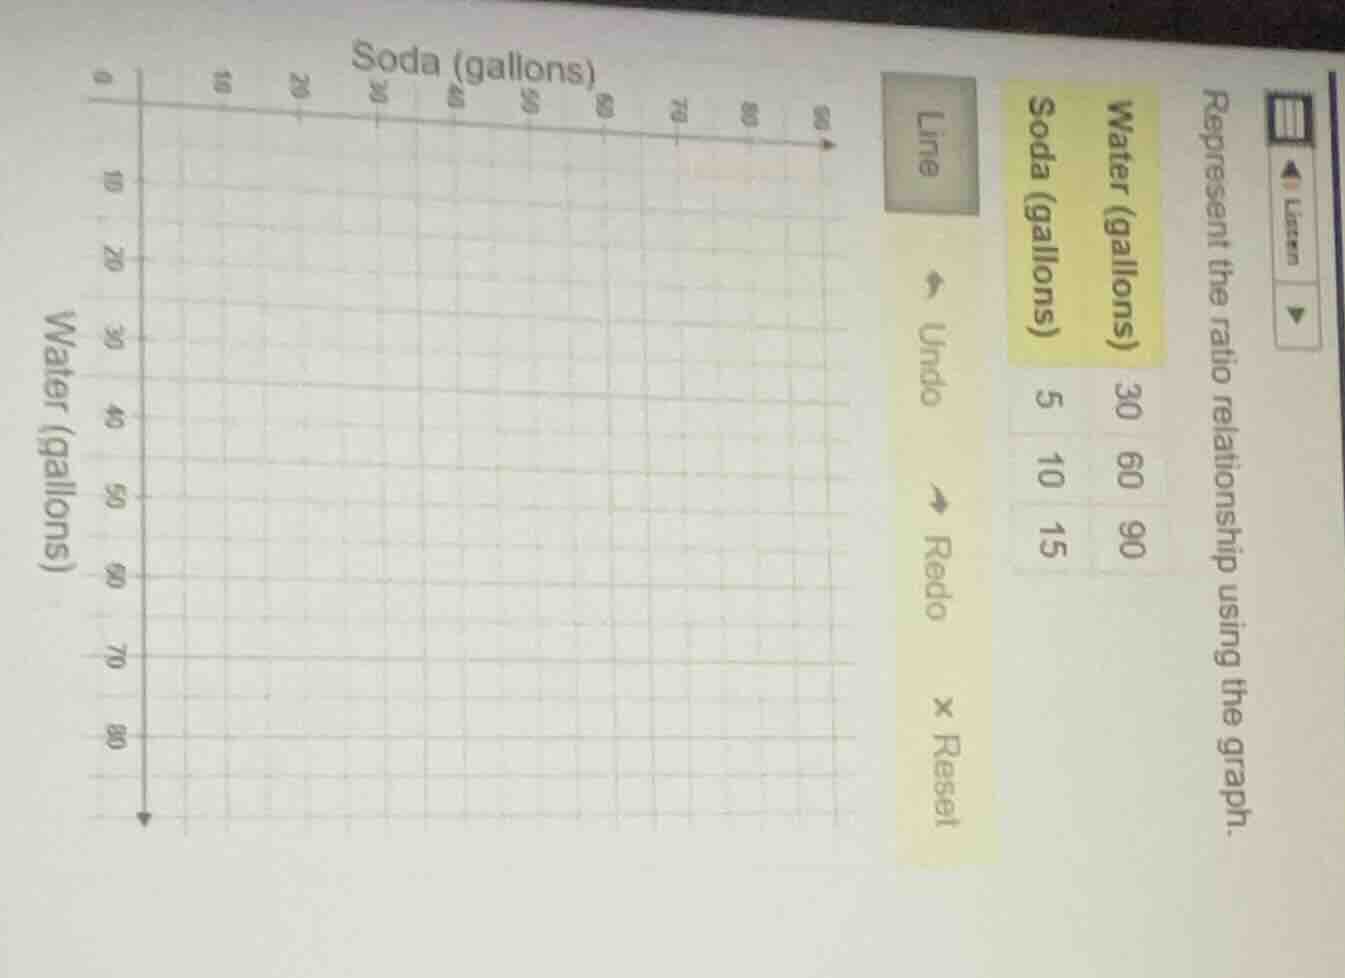
represent the ratio relationship using the graph.
water (gallons) \tsoda (gallons)
30 \t5
60 \t10
90 \t15
(graph with x - axis labeled soda (gallons) from 0 to 90, y - axis labeled water (gallons) from 0 to 90, and grid lines. buttons: line, undo, redo, reset)
Step1: Identify the ratio
The ratio of Water to Soda is $\frac{30}{5} = 6$, so $Water = 6 \times Soda$.
Step2: Plot given points
- For Soda = 5, Water = 30: Plot $(5, 30)$
- For Soda = 10, Water = 60: Plot $(10, 60)$
- For Soda = 15, Water = 90: Plot $(15, 90)$
Step3: Draw the trend line
Connect the plotted points and extend the line through the origin $(0,0)$ (since 0 soda corresponds to 0 water) to show the proportional relationship.

Snap & solve any problem in the app
Get step-by-step solutions on Sovi AI
Photo-based solutions with guided steps
Explore more problems and detailed explanations
A line passing through the points $(0,0)$, $(5, 30)$, $(10, 60)$, and $(15, 90)$ on the graph, with the x-axis (Soda, gallons) and y-axis (Water, gallons), represents the ratio relationship.