QUESTION IMAGE
Question
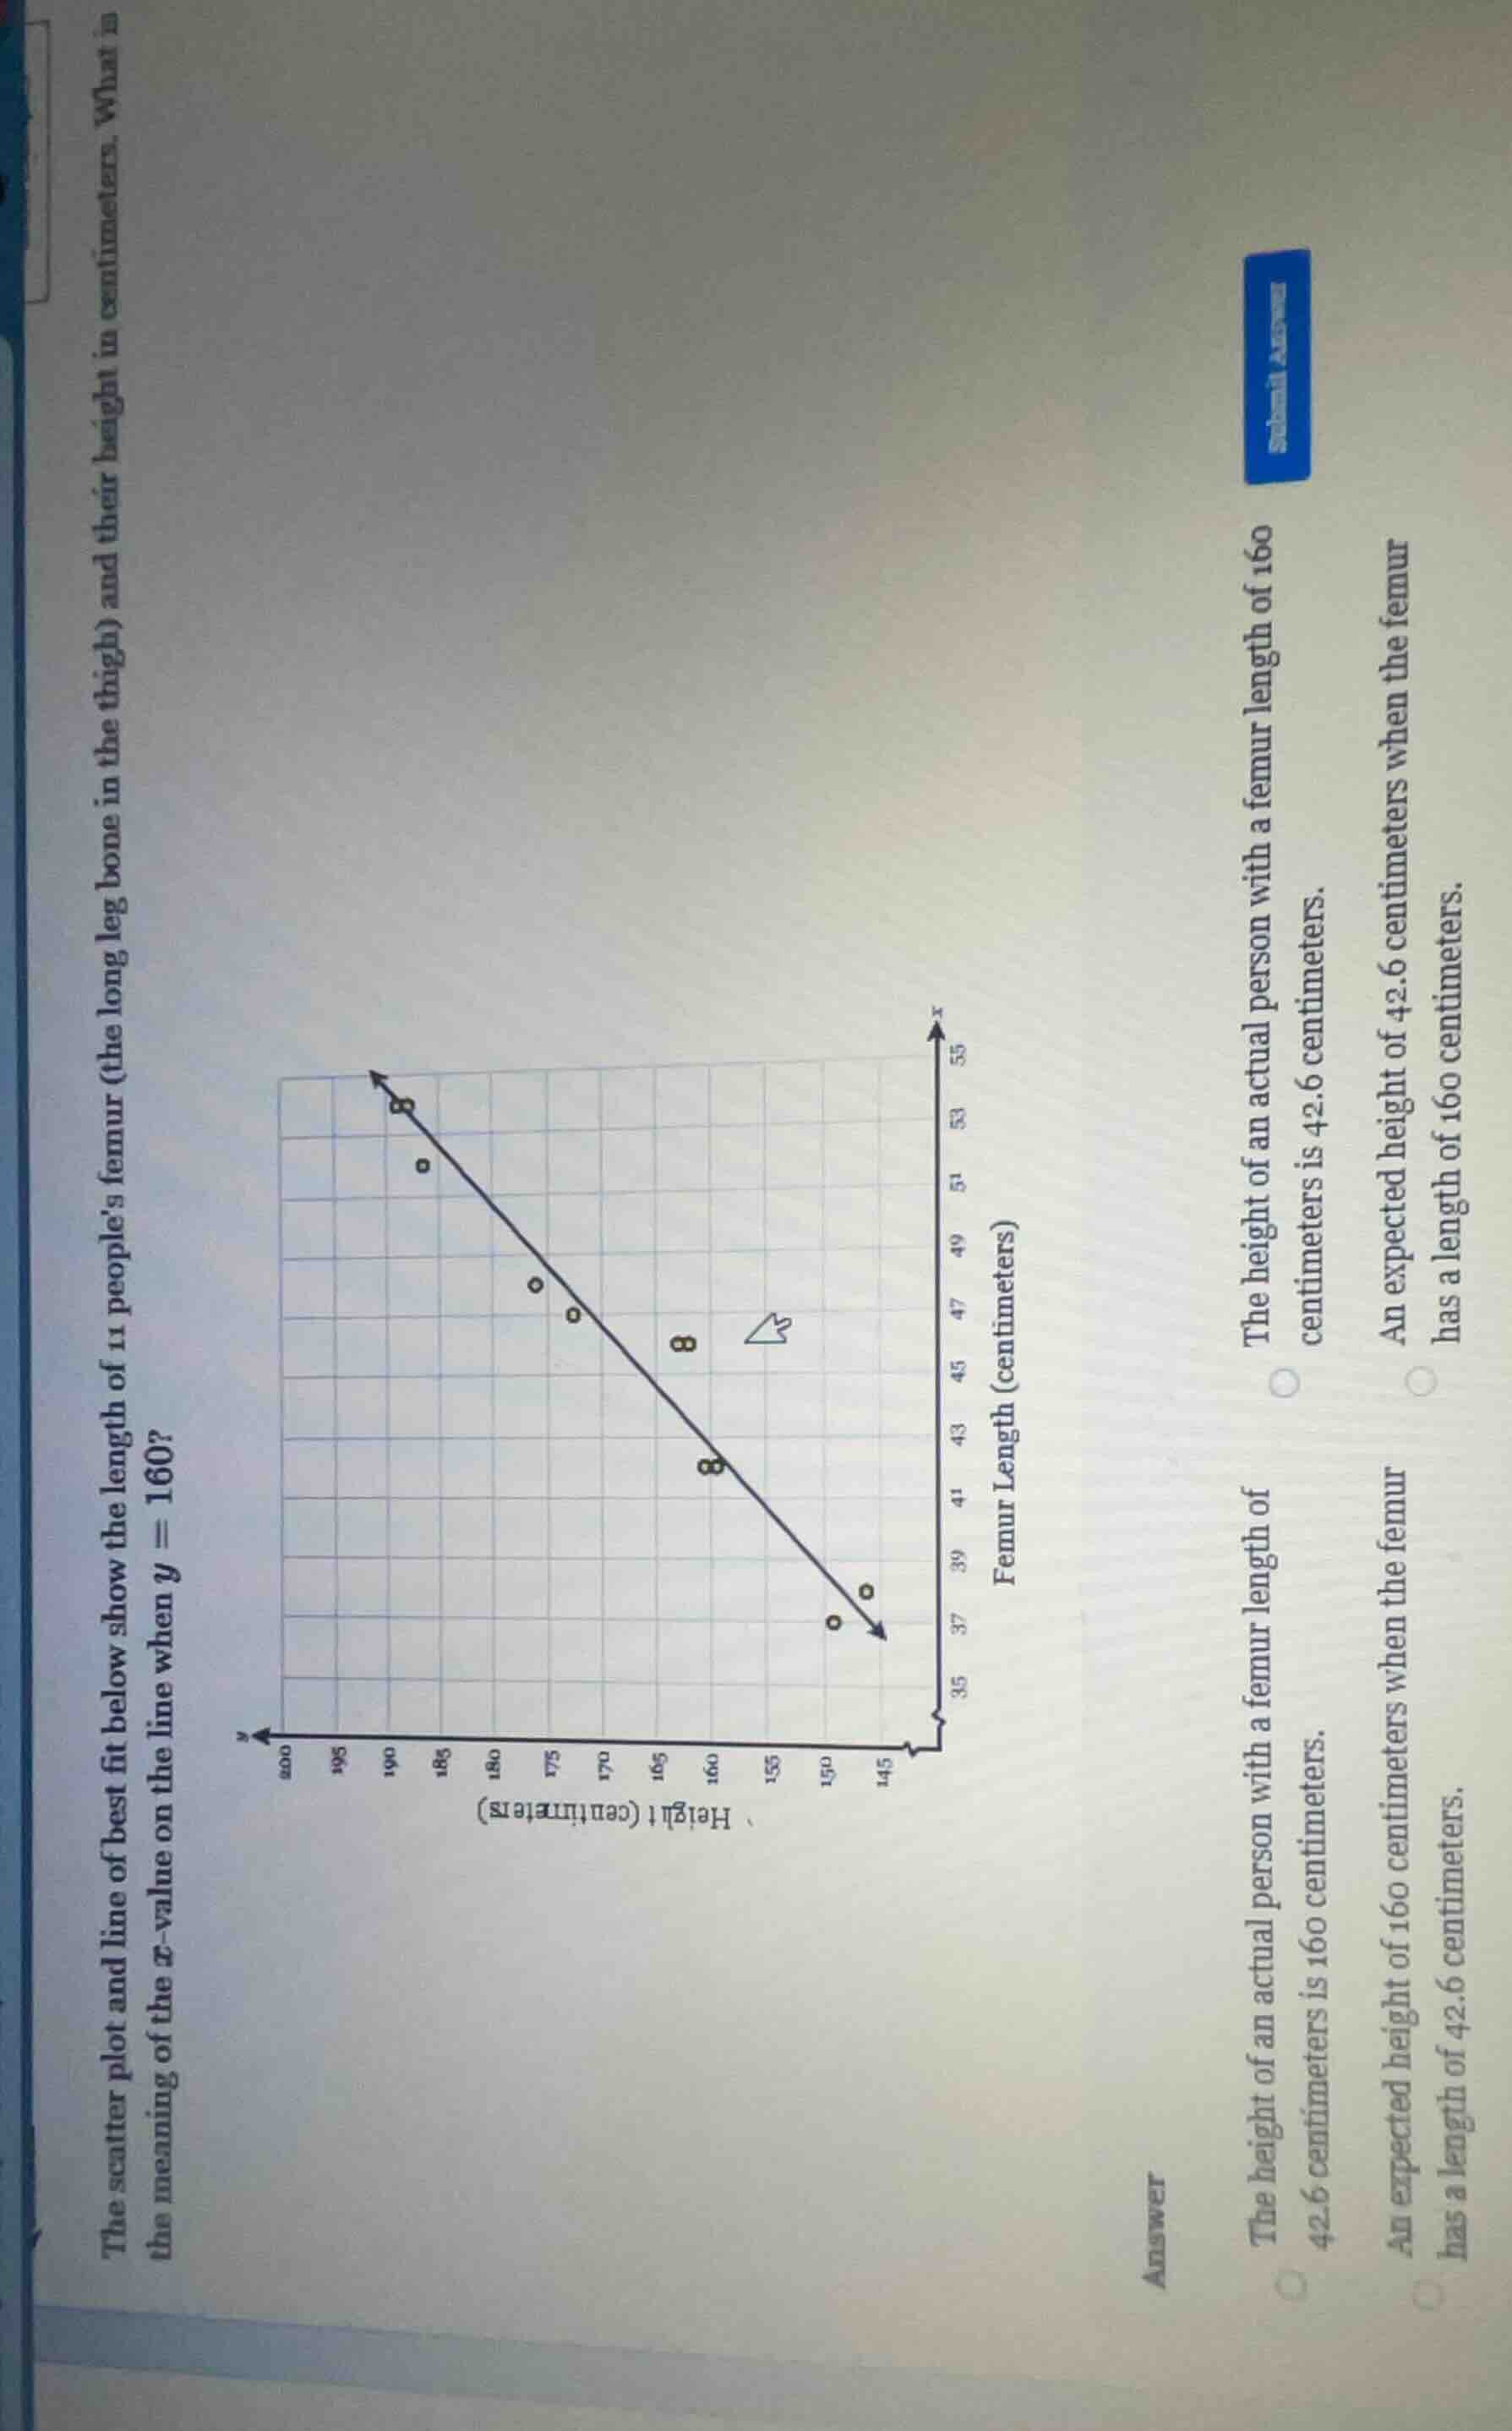
the scatter plot and line of best fit below show the length of 11 peoples femur (the long leg bone in the thigh) and their height in centimeters. what is the meaning of the x - value on the line when y = 160?
options:
the height of an actual person with a femur length of 42.6 centimeters is 160 centimeters.
an expected height of 160 centimeters when the femur has a length of 42.6 centimeters.
the height of an actual person with a femur length of 160 centimeters is 42.6 centimeters.
an expected height of 42.6 centimeters when the femur has a length of 160 centimeters.
The line of best fit represents the expected (predicted) relationship between femur length (x-axis) and height (y-axis). When $y=160$ (height is 160 cm), the corresponding x-value is the predicted femur length for a person of that height.

Snap & solve any problem in the app
Get step-by-step solutions on Sovi AI
Photo-based solutions with guided steps
Explore more problems and detailed explanations
An expected height of 160 centimeters when the femur has a length of 42.6 centimeters.