QUESTION IMAGE
Question
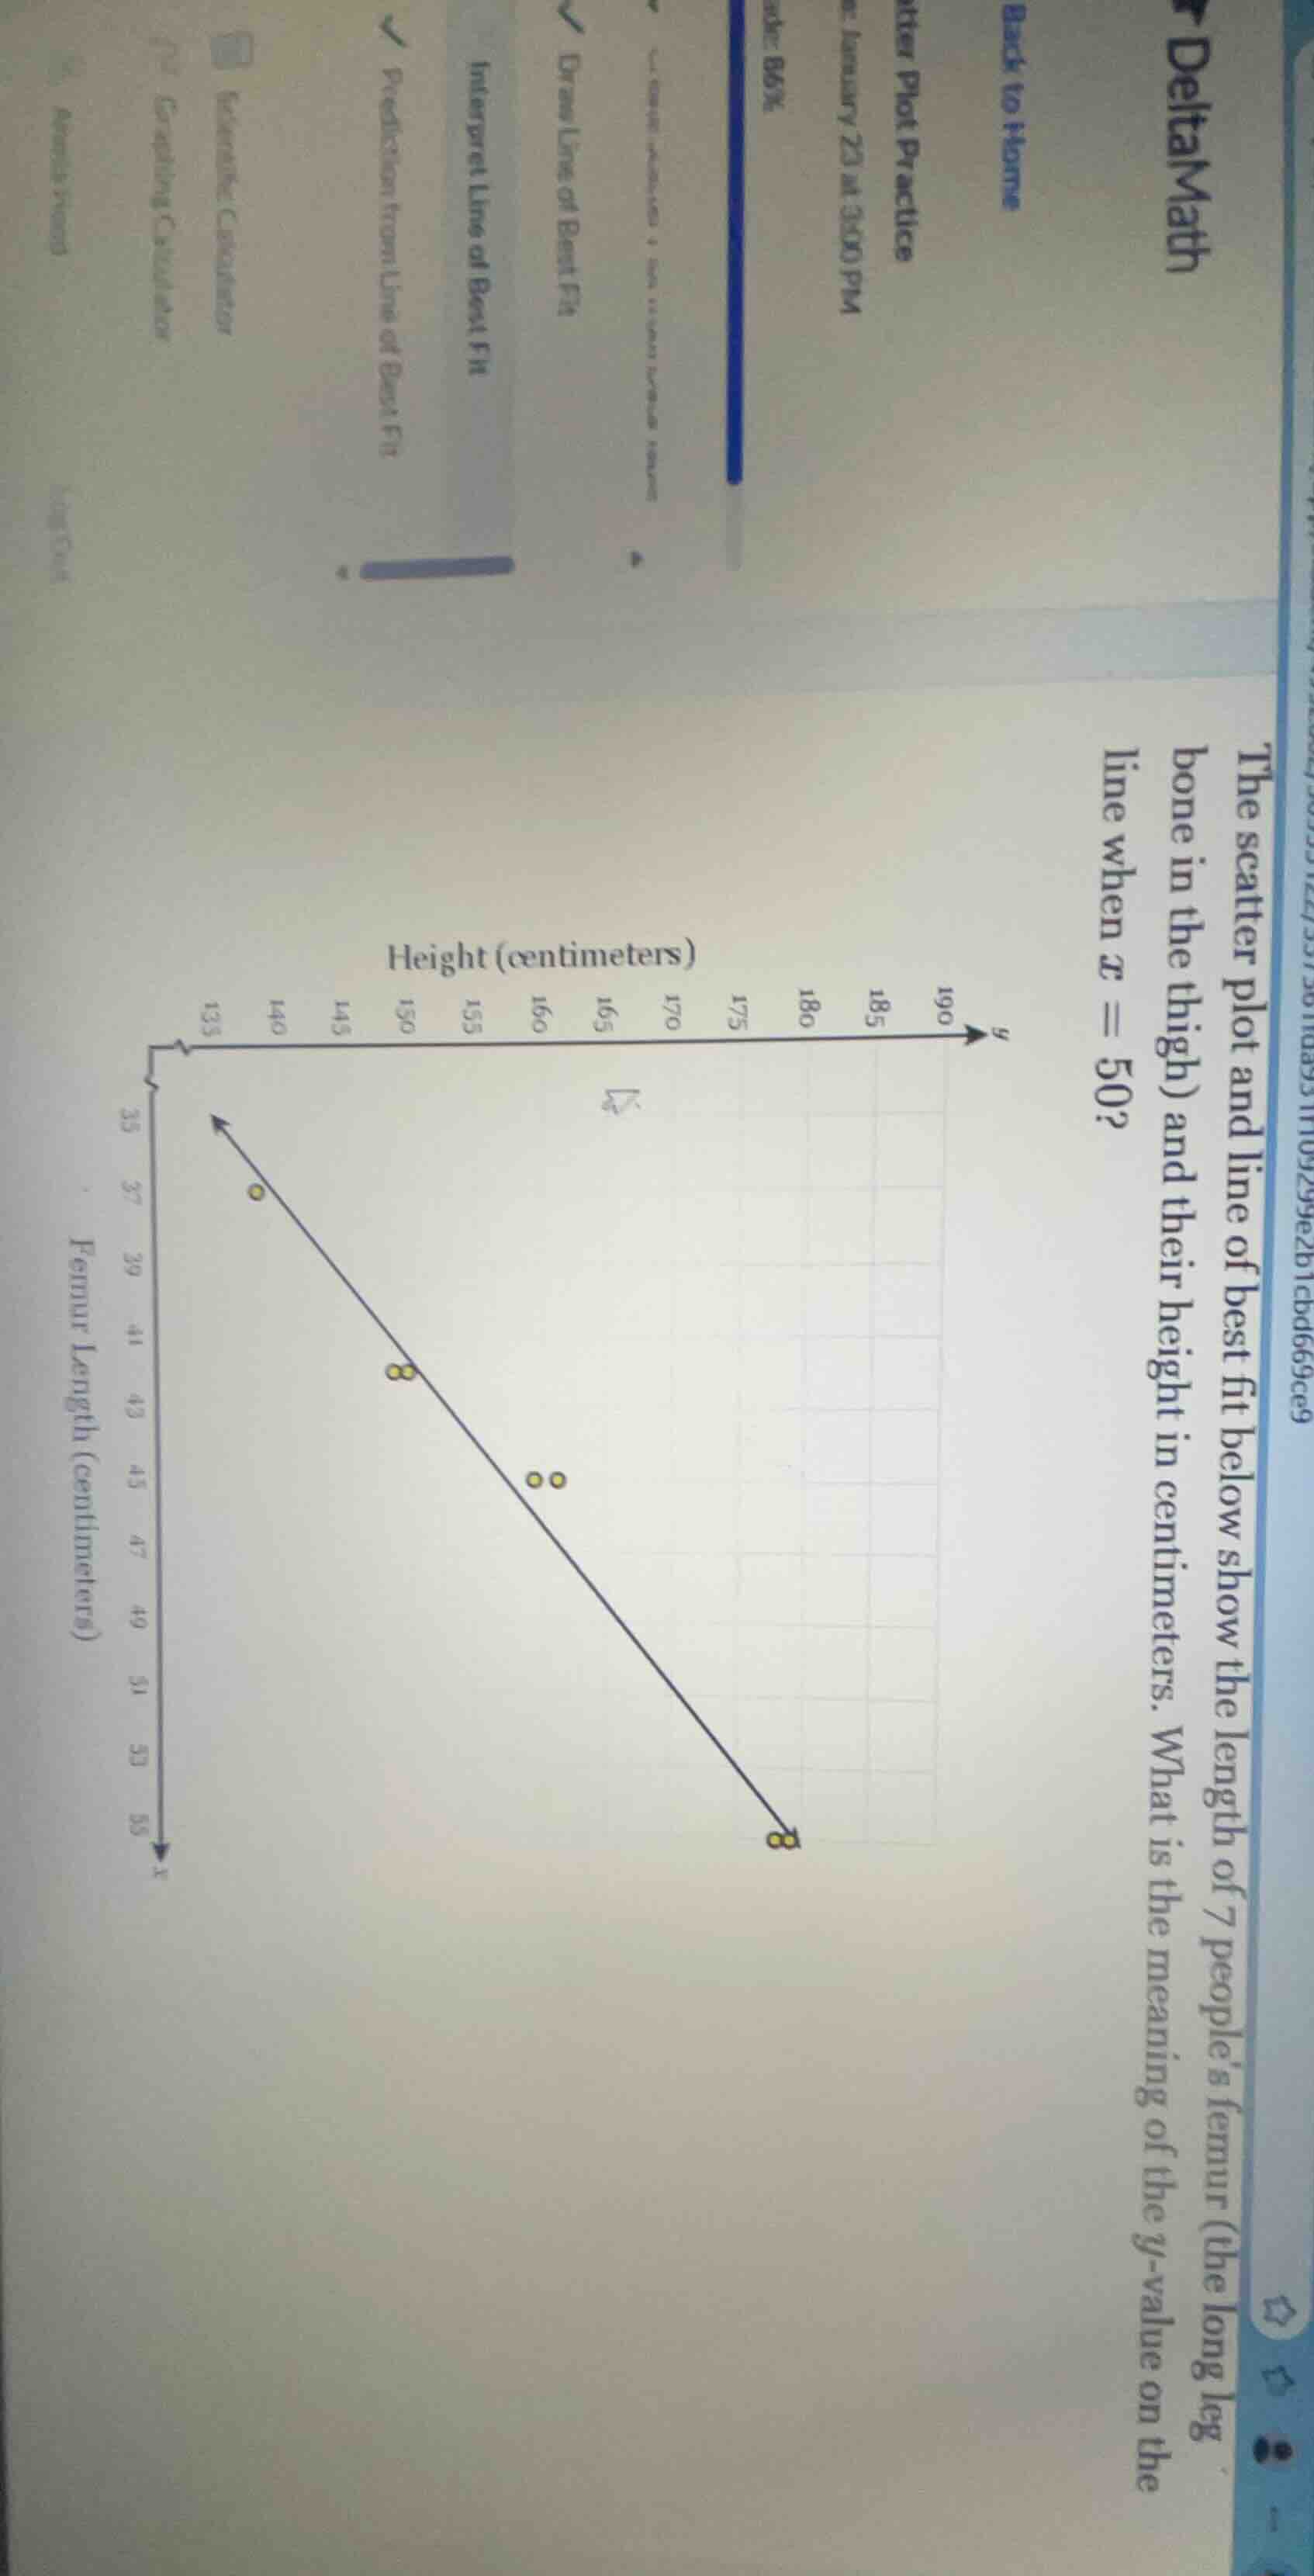
the scatter plot and line of best fit below show the length of 7 people’s femur (the long leg bone in the thigh) and their height in centimeters. what is the meaning of the y - value on the line when x = 50?
Step1: Identify line equation first
We use two points on the line: let's take $(x_1,y_1)=(37,140)$ and $(x_2,y_2)=(53,180)$. First calculate slope $m$:
$m=\frac{y_2-y_1}{x_2-x_1}=\frac{180-140}{53-37}=\frac{40}{16}=2.5$
Then use point-slope form $y-y_1=m(x-x_1)$:
$y-140=2.5(x-37)$
Simplify to slope-intercept:
$y=2.5x - 92.5 + 140=2.5x + 47.5$
Step2: Substitute $x=50$ into equation
$y=2.5(50)+47.5$
Step3: Compute the final value
$y=125+47.5=172.5$

Snap & solve any problem in the app
Get step-by-step solutions on Sovi AI
Photo-based solutions with guided steps
Explore more problems and detailed explanations
When $x=50$, the $y$-value of 172.5 means that a person with a femur length of 50 centimeters is predicted to have a height of 172.5 centimeters, according to the line of best fit.