QUESTION IMAGE
Question
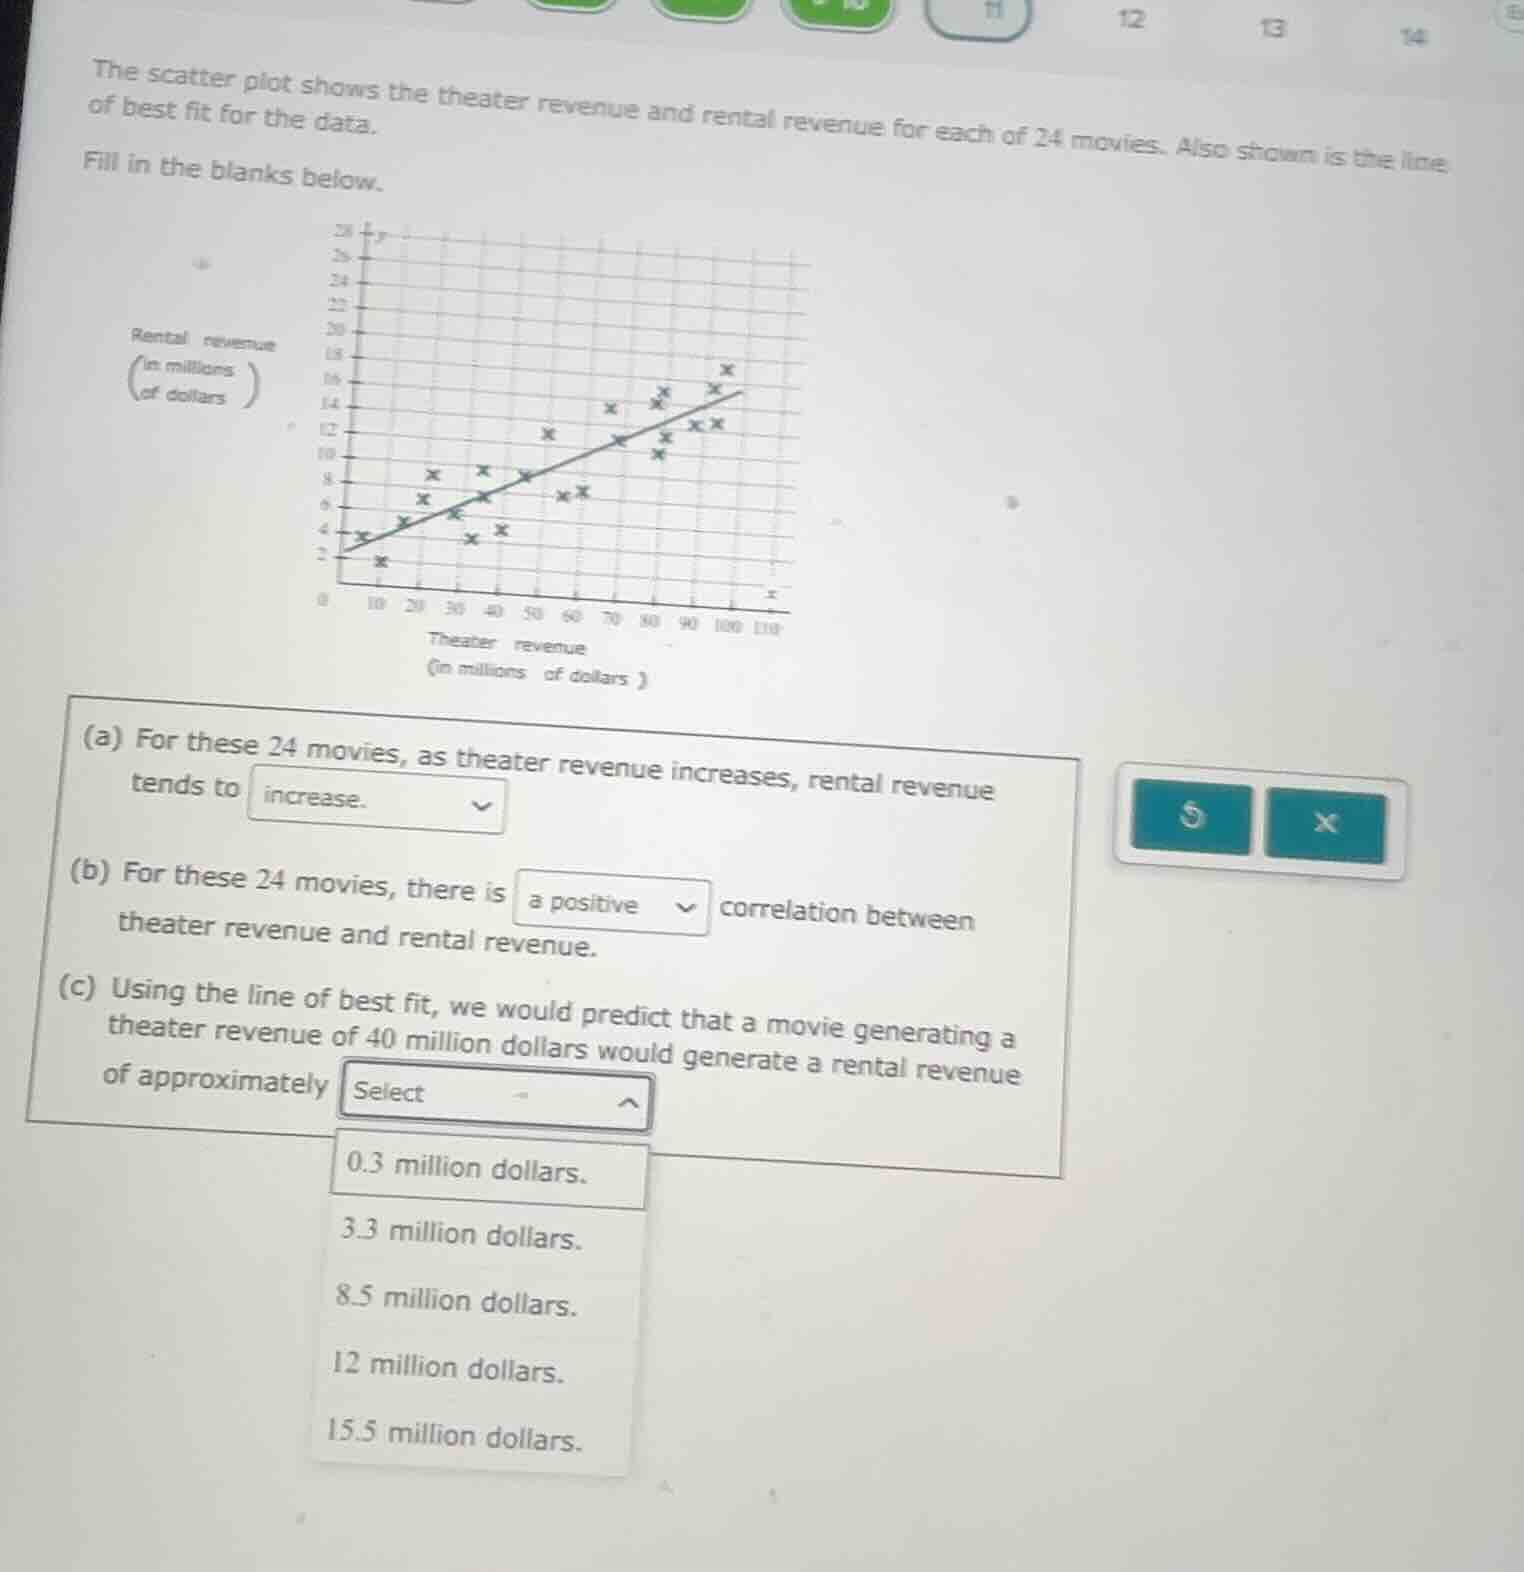
the scatter plot shows the theater revenue and rental revenue for each of 24 movies. also shown is the line of best fit for the data. fill in the blanks below. (a) for these 24 movies, as theater revenue increases, rental revenue tends to increase. (b) for these 24 movies, there is a positive correlation between theater revenue and rental revenue. (c) using the line of best fit, we would predict that a movie generating a theater revenue of 40 million dollars would generate a rental revenue of approximately select 0.3 million dollars. 3.3 million dollars. 8.5 million dollars. 12 million dollars. 15.5 million dollars.
Part (c)
Step1: Analyze the line of best fit
The line of best fit in the scatter plot shows the trend between theater revenue (x - axis) and rental revenue (y - axis). We need to find the rental revenue (y - value) when theater revenue (x) is 40 million dollars by looking at the line of best fit.
Step2: Estimate the y - value at x = 40
Looking at the scatter plot, when the theater revenue (x) is 40 million dollars, we check the line of best fit. From the grid and the line, we can see that the corresponding rental revenue (y) is approximately 8.5 million dollars? Wait, no, wait. Wait, let's re - check. Wait, the x - axis is theater revenue (in millions) and y - axis is rental revenue (in millions). Let's look at the line. When x = 40, let's see the y - coordinate of the line. Wait, maybe I made a mistake. Wait, let's see the points. Wait, the line of best fit: when x = 40, let's check the y - value. Wait, the options are 0.3, 3.3, 8.5, 12, 15.5. Wait, maybe my initial thought was wrong. Wait, let's think again. Wait, the line of best fit: let's find two points on the line. For example, when x = 0, y is around 2? Wait, no, when x = 10, y is around 4? Wait, no, let's take two points. Let's say when x = 0, y = 2 (intercept), and when x = 100, y = 16 (approximate). So the slope $m=\frac{16 - 2}{100-0}=\frac{14}{100}=0.14$. Then the equation is $y = 0.14x+2$. When x = 40, $y=0.14\times40 + 2=5.6 + 2 = 7.6$, which is close to 8.5? Wait, maybe my two points are wrong. Alternatively, looking at the scatter plot, when x = 40 (theater revenue), the line of best fit is at y around 8.5? Wait, no, wait the options: 8.5 is one of them. Wait, maybe I misread the axes. Wait, the x - axis is theater revenue (in millions), y - axis is rental revenue (in millions). Let's look at the grid. Each grid square: x - axis, from 0 to 10, 20, etc. Y - axis, from 0 to 2, 4, 6, 8, etc. When x = 40, the line of best fit is at y = 8.5? Wait, no, maybe 8.5 is the answer. Wait, let's check the options again. The options are 0.3, 3.3, 8.5, 12, 15.5. So when x = 40, the rental revenue from the line of best fit is approximately 8.5 million dollars? Wait, no, wait maybe I made a mistake. Wait, let's see the line. At x = 40, the line is at y = 8.5? Wait, maybe. Alternatively, maybe 8.5 is the correct answer. Wait, but let's think again. Wait, if x = 40, and the line of best fit, let's see the y - value. Let's check the other options. 0.3 is too low, 3.3 is also low, 12 is too high, 15.5 is too high. So 8.5 is the most appropriate.

Snap & solve any problem in the app
Get step-by-step solutions on Sovi AI
Photo-based solutions with guided steps
Explore more problems and detailed explanations
8.5 million dollars.