QUESTION IMAGE
Question
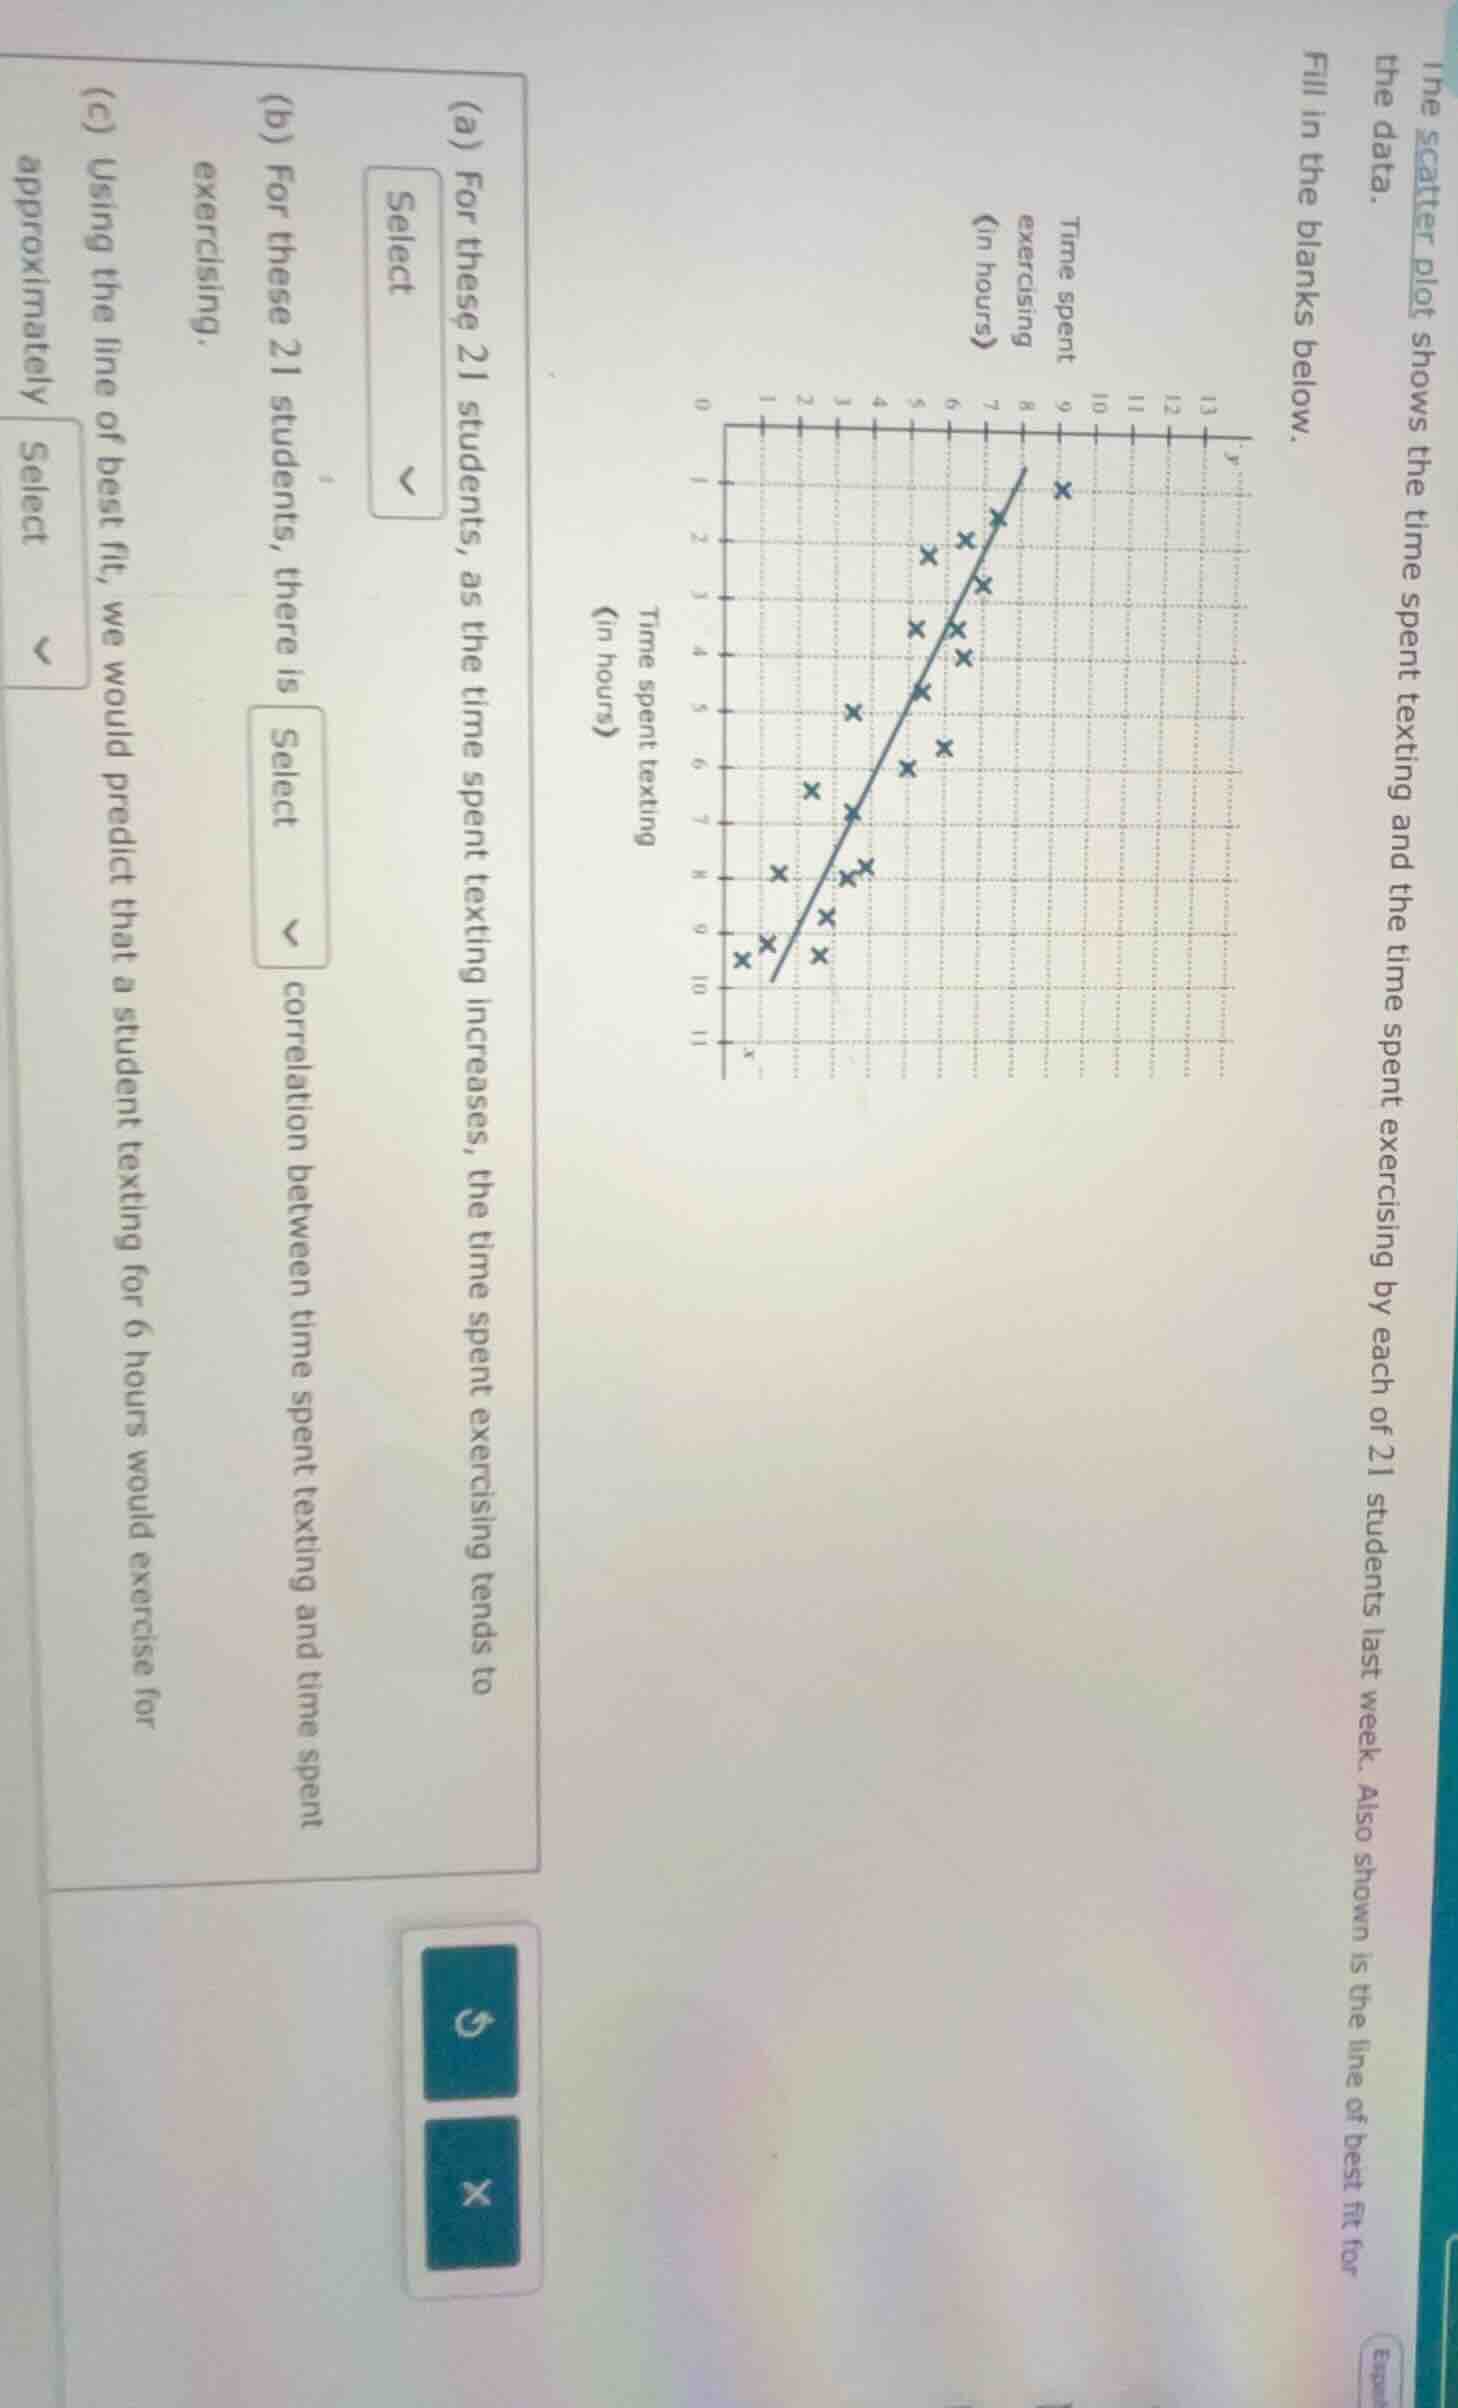
the scatter plot shows the time spent texting and the time spent exercising by each of 21 students last week. also shown is the line of best fit for the data. fill in the blanks below. (a) for these 21 students, as the time spent texting increases, the time spent exercising tends to select (b) for these 21 students, there is select correlation between time spent texting and time spent exercising. (c) using the line of best fit, we would predict that a student texting for 6 hours would exercise for approximately select
Part (a)
Looking at the scatter plot and the line of best fit, as the time spent texting (x - axis) increases, the time spent exercising (y - axis) tends to decrease. This is because the line of best fit has a negative slope, indicating a negative relationship between the two variables.
Step 1: Analyze the trend
The scatter plot and the line of best fit show that as \( x \) (texting time) increases, \( y \) (exercising time) moves in the downward direction. So the time spent exercising tends to decrease.
Since as texting time increases, exercising time decreases, the correlation between time spent texting and time spent exercising is negative. A negative correlation means that as one variable increases, the other variable tends to decrease, which matches the trend we observed from the scatter plot and the line of best fit.
Step 1: Determine correlation type
We know that when two variables have a relationship where an increase in one leads to a decrease in the other, the correlation is negative. From part (a), we saw that texting time and exercising time have such a relationship. So the correlation is negative.
To find the predicted exercising time for a student who texts for 6 hours, we use the line of best fit. First, we need to find the equation of the line of best fit. Let's assume the line of best fit has a slope - intercept form \( y=mx + b \). From the graph, we can take two points on the line of best fit. Let's say when \( x = 10 \) (texting time), \( y=0 \) (exercising time) and when \( x = 0 \), \( y = 10 \) (we can estimate these points from the line). The slope \( m=\frac{y_2 - y_1}{x_2 - x_1}=\frac{0 - 10}{10-0}=- 1 \). So the equation of the line is \( y=-x + 10 \). Now, when \( x = 6 \) (texting time is 6 hours), we substitute \( x = 6 \) into the equation: \( y=-6 + 10=4 \). Wait, maybe a better way is to look at the line. When \( x = 6 \) (texting time), we find the corresponding \( y \) - value on the line of best fit. From the graph, if we move to \( x = 6 \) on the x - axis (texting time = 6 hours) and then find the y - value (exercising time) on the line of best fit, we can see that it is approximately 4 hours? Wait, no, maybe my initial point selection was wrong. Let's re - estimate. Let's take two points on the line: when \( x = 9 \), \( y = 1 \) and when \( x = 1 \), \( y=9 \). The slope \( m=\frac{9 - 1}{1 - 9}=\frac{8}{-8}=-1 \). So the equation is \( y=-x + 10 \). So when \( x = 6 \), \( y=-6 + 10 = 4 \)? Wait, no, if \( x = 6 \), \( y=-6 + 10 = 4 \)? Wait, maybe I made a mistake in the direction of the axes. Wait, the x - axis is time spent texting (in hours) and the y - axis is time spent exercising (in hours). Let's look at the graph again. When texting time (x) is 5, exercising time (y) is 5? No, the line of best fit: let's take a point where \( x = 5 \), what's \( y \)? From the graph, when \( x = 5 \) (texting time), the line of best fit is at \( y = 5 \)? Wait, no, maybe my earlier approach is wrong. Let's use the fact that when \( x=6 \), we can look at the line. If we go to \( x = 6 \) on the x - axis (texting time = 6 hours) and then find the y - coordinate on the line of best fit. From the scatter plot, the line of best fit seems to pass through points that suggest that when \( x = 6 \), \( y = 4 \)? Wait, no, maybe it's 4? Wait, let's check with another method. The general idea is that we use the line of best fit to predict \( y \) when \( x = 6 \). Let's assume the line of best fit has the equation \( y=-x + 10 \) (as we derived earlier). So when \( x = 6 \), \( y=-6 + 10 = 4 \). Wait, but maybe the correct answer is 4? Wait, no, maybe I messed up the axes. Wait, the x - axis is time spent texting (in hours) and the y - axis is time spent exercising (in hours). Let's take two points on the line: (10,0) and (0,10). So the equation is \( y=-x + 10 \). So when \( x = 6 \), \( y = 4 \). So the predicted exercising time is 4 hours.
Step 1: Find the equation of the line of best fit
We assume the line of best fit has the form \( y=mx + b \). By observing two points on the line (e.g., \( (10,0) \) and \( (0,10) \)), we calculate the slope \( m=\frac{0 - 10}{10 - 0}=-1 \) and the y - intercept \( b = 10 \). So the equation is \( y=-x + 10 \).
Step 2: Substitute \( x = 6 \) into the equation
We substitute \( x = 6 \) into \( y=-x + 10 \). So \( y=-6 + 10 = 4 \).

Snap & solve any problem in the app
Get step-by-step solutions on Sovi AI
Photo-based solutions with guided steps
Explore more problems and detailed explanations
decrease