QUESTION IMAGE
Question
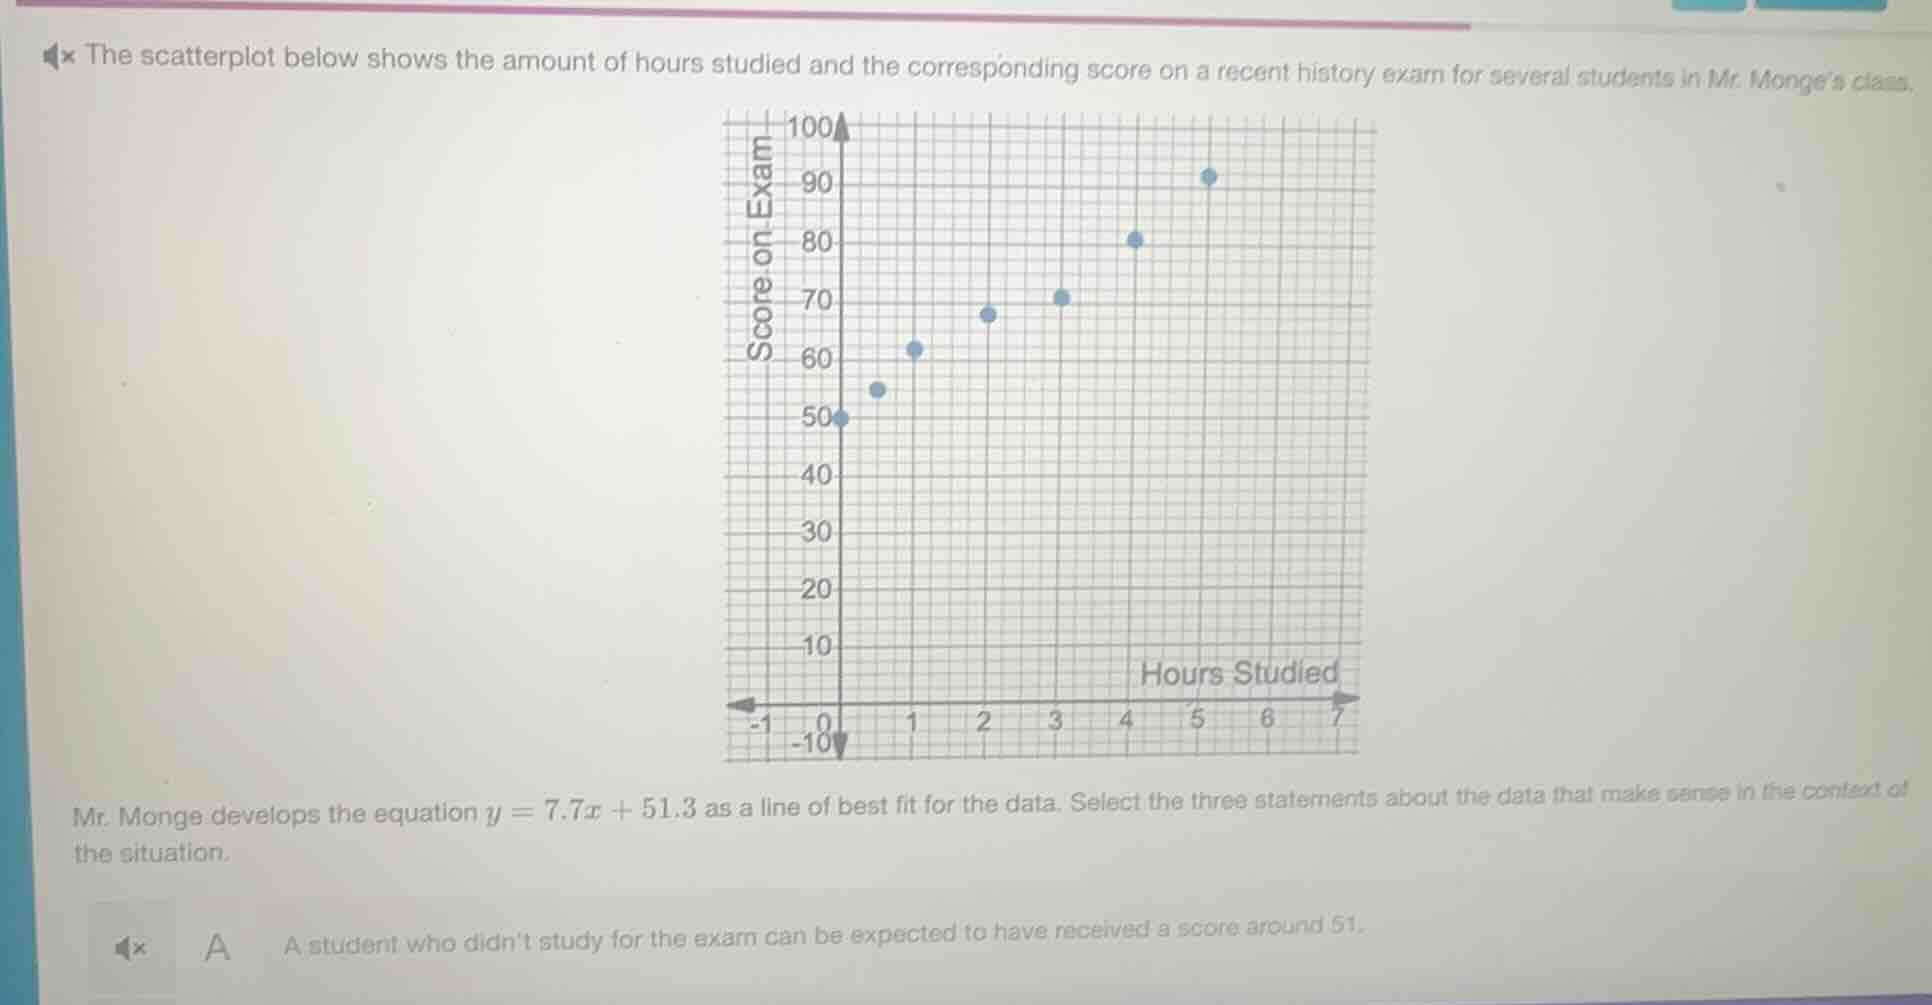
the scatterplot below shows the amount of hours studied and the corresponding score on a recent history exam for several students in mr. monge’s class. mr. monge develops the equation $y = 7.7x + 51.3$ as a line of best fit for the data. select the three statements about the data that make sense in the context of the situation. a a student who didn’t study for the exam can be expected to have received a score around 51.
To solve this, we analyze each statement (assuming other options exist, but let's start with option A):
For Option A:
The line of best fit is \( y = 7.7x + 51.3 \), where \( x \) is hours studied and \( y \) is exam score. If a student didn't study, \( x = 0 \). Substitute \( x = 0 \) into the equation:
\( y = 7.7(0) + 51.3 = 51.3 \approx 51 \). So this statement makes sense.
(Note: Since the full list of options isn't provided, but for the given option A, it's valid. If other options were, say, about slope interpretation (7.7 means ~7.7 point increase per hour studied) or predicting scores for given hours, we'd check similarly. But based on the given info, option A is correct.)

Snap & solve any problem in the app
Get step-by-step solutions on Sovi AI
Photo-based solutions with guided steps
Explore more problems and detailed explanations
A. A student who didn’t study for the exam can be expected to have received a score around 51.
(If more options were provided, we'd analyze each, but with the current info, A is valid. For the "three statements" part, we'd need the full list, but for the given A, it's correct as shown.)