QUESTION IMAGE
Question
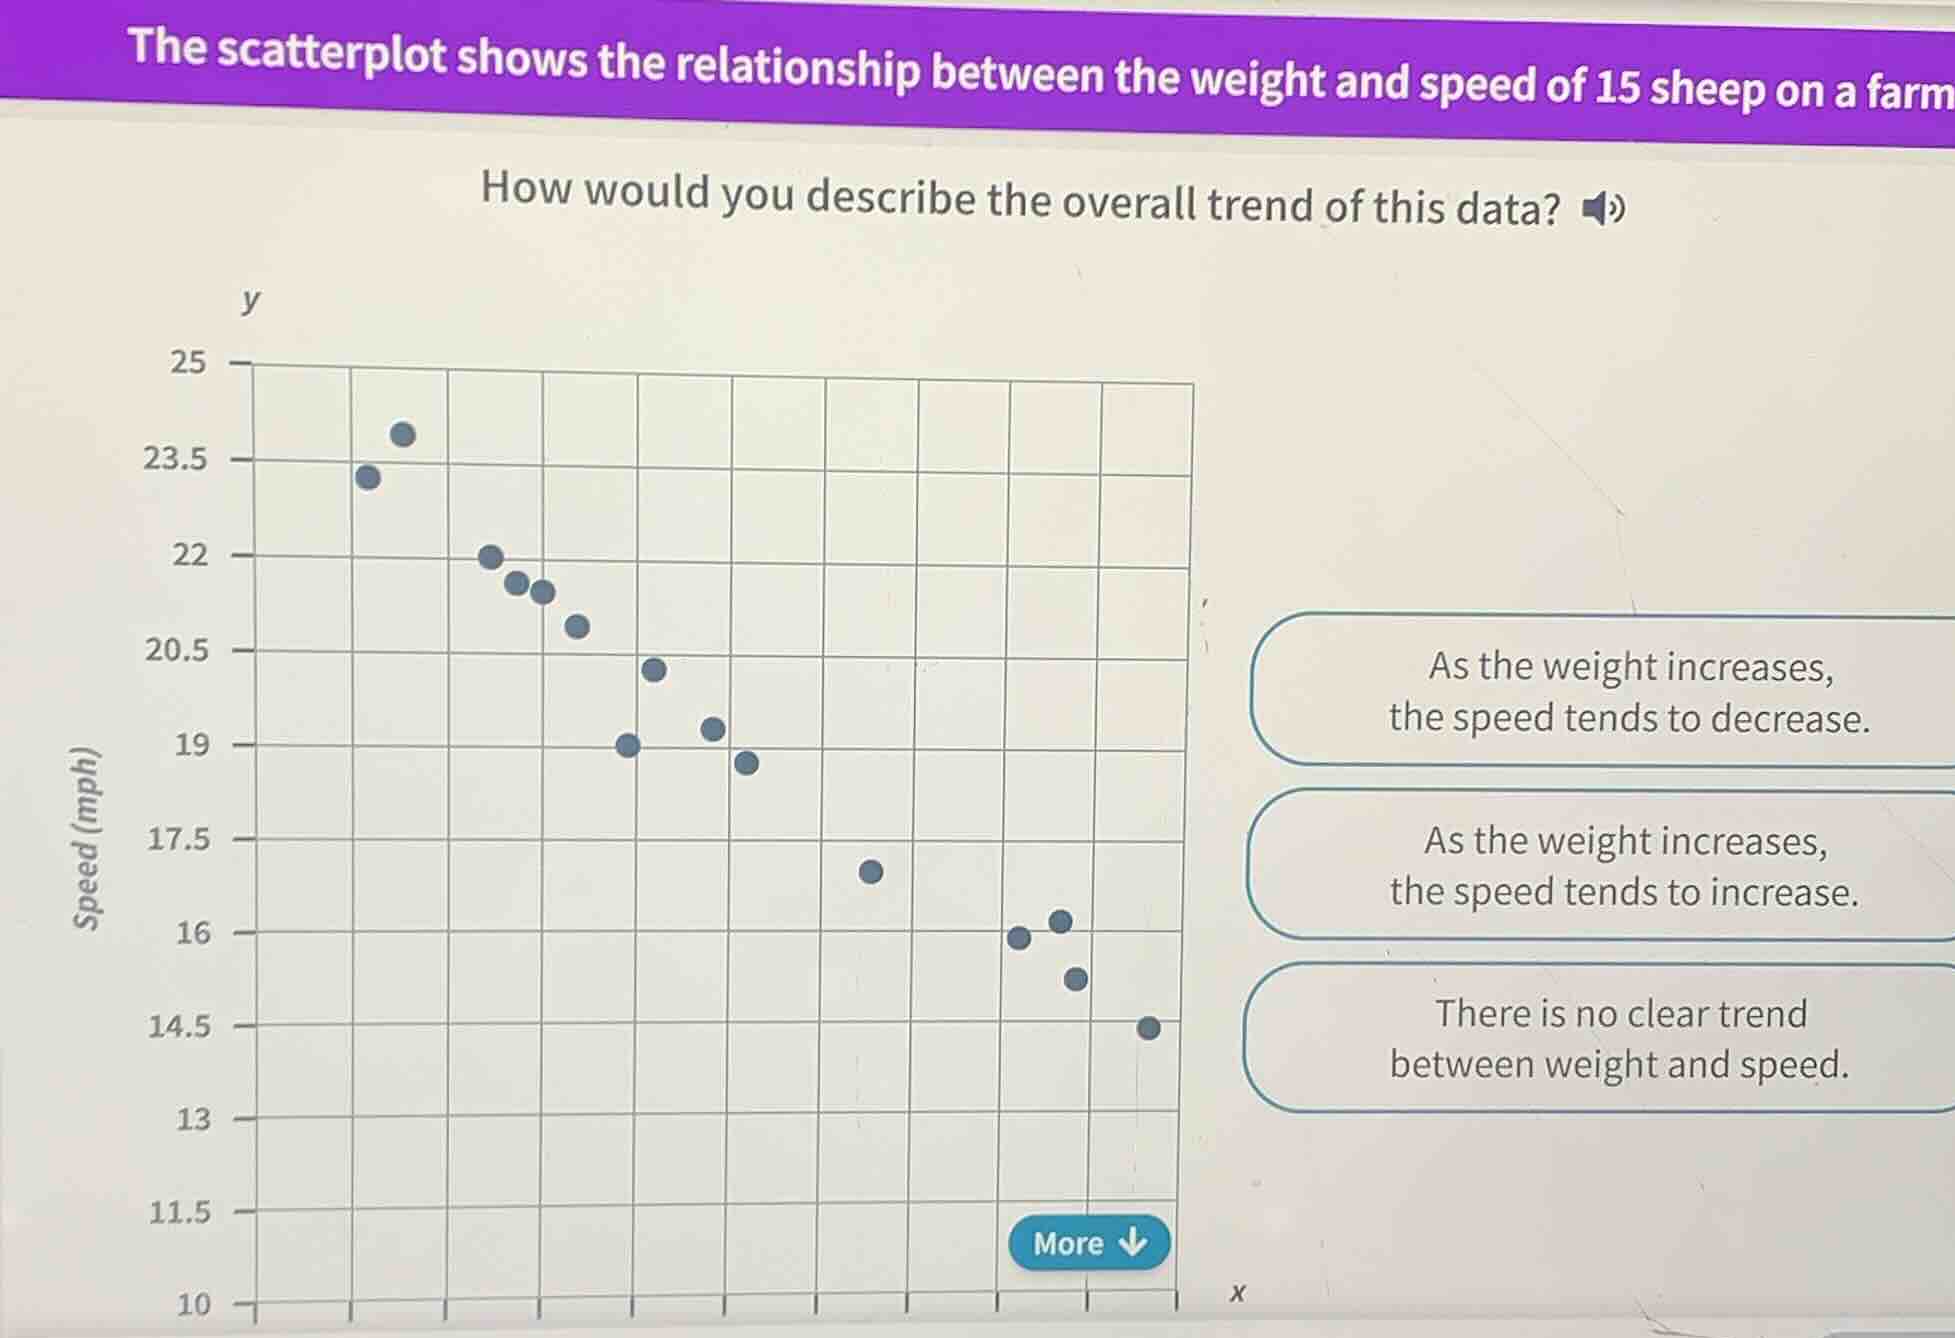
the scatterplot shows the relationship between the weight and speed of 15 sheep on a farm
how would you describe the overall trend of this data?
options:
as the weight increases, the speed tends to decrease.
as the weight increases, the speed tends to increase.
there is no clear trend between weight and speed.
To determine the trend, we analyze the scatterplot. As the \( x \)-axis (weight) values increase, the \( y \)-axis (speed) values generally decrease. The points show a negative association, meaning as weight increases, speed tends to decrease. The other options are incorrect: the second option suggests a positive trend (opposite of what's seen), and the third option is wrong as there is a clear negative trend.

Snap & solve any problem in the app
Get step-by-step solutions on Sovi AI
Photo-based solutions with guided steps
Explore more problems and detailed explanations
As the weight increases, the speed tends to decrease.