QUESTION IMAGE
Question
scientific inquiry unit review
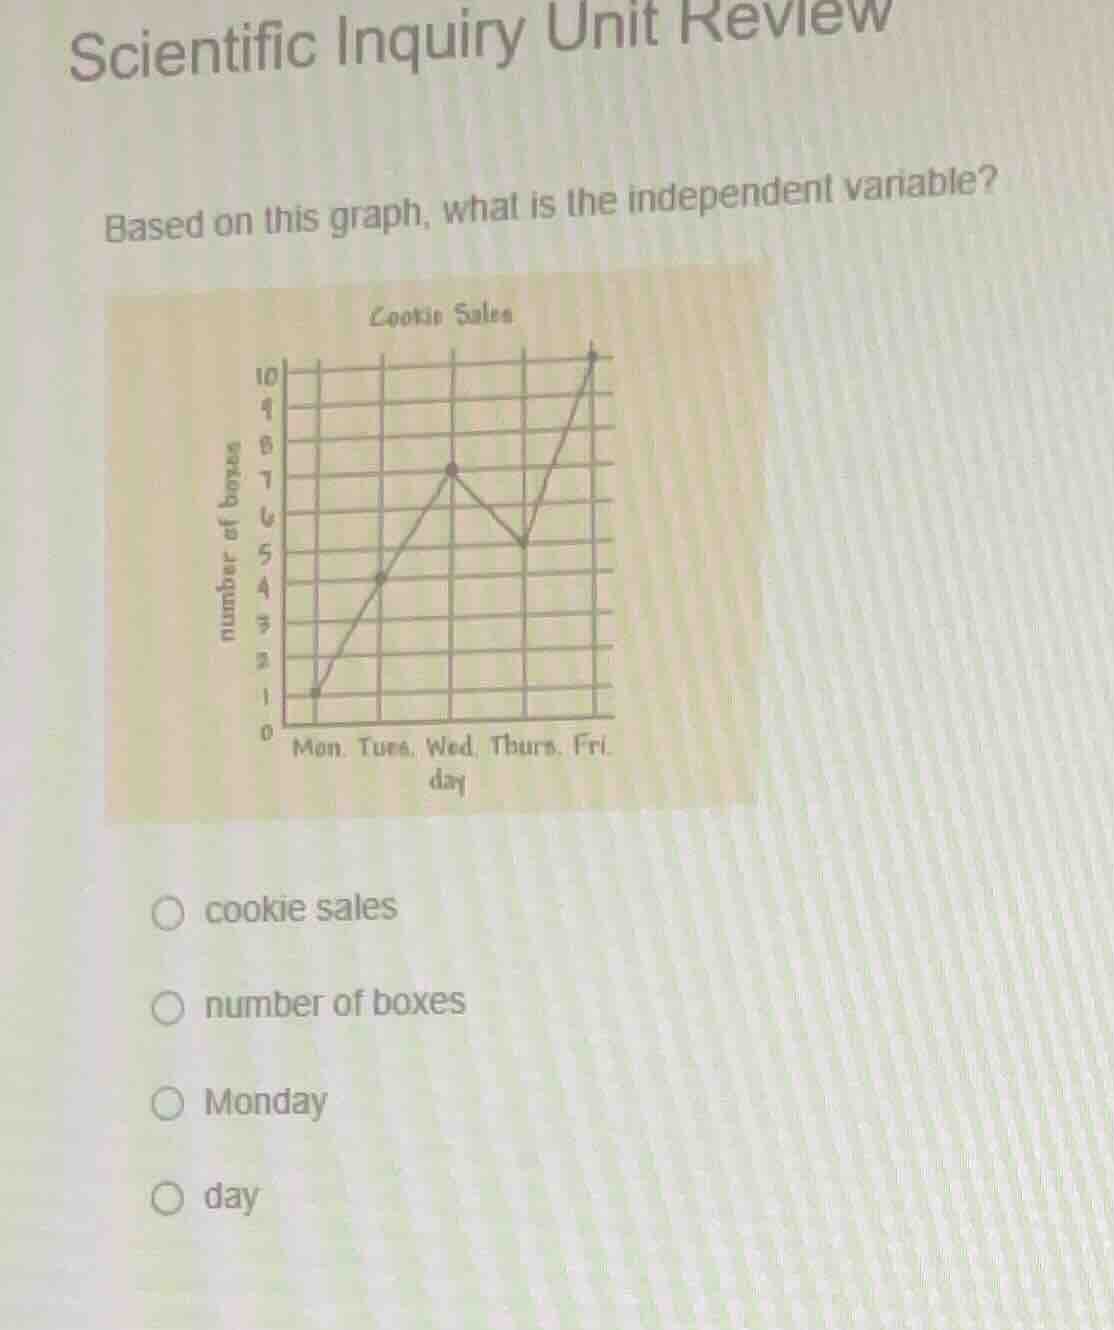
based on this graph, what is the independent variable?
cookie sales
number of boxes
0
mon. tues. wed. thurs. fri.
day
cookie sales
number of boxes
monday
day
Brief Explanations
The independent variable is the factor that is manipulated or changed, plotted on the x-axis of a graph. In this graph, the x-axis shows "day" (Mon-Fri), while the y-axis (dependent variable) shows the number of cookie boxes sold, which depends on the day.

Snap & solve any problem in the app
Get step-by-step solutions on Sovi AI
Photo-based solutions with guided steps
Explore more problems and detailed explanations
○ day