QUESTION IMAGE
Question
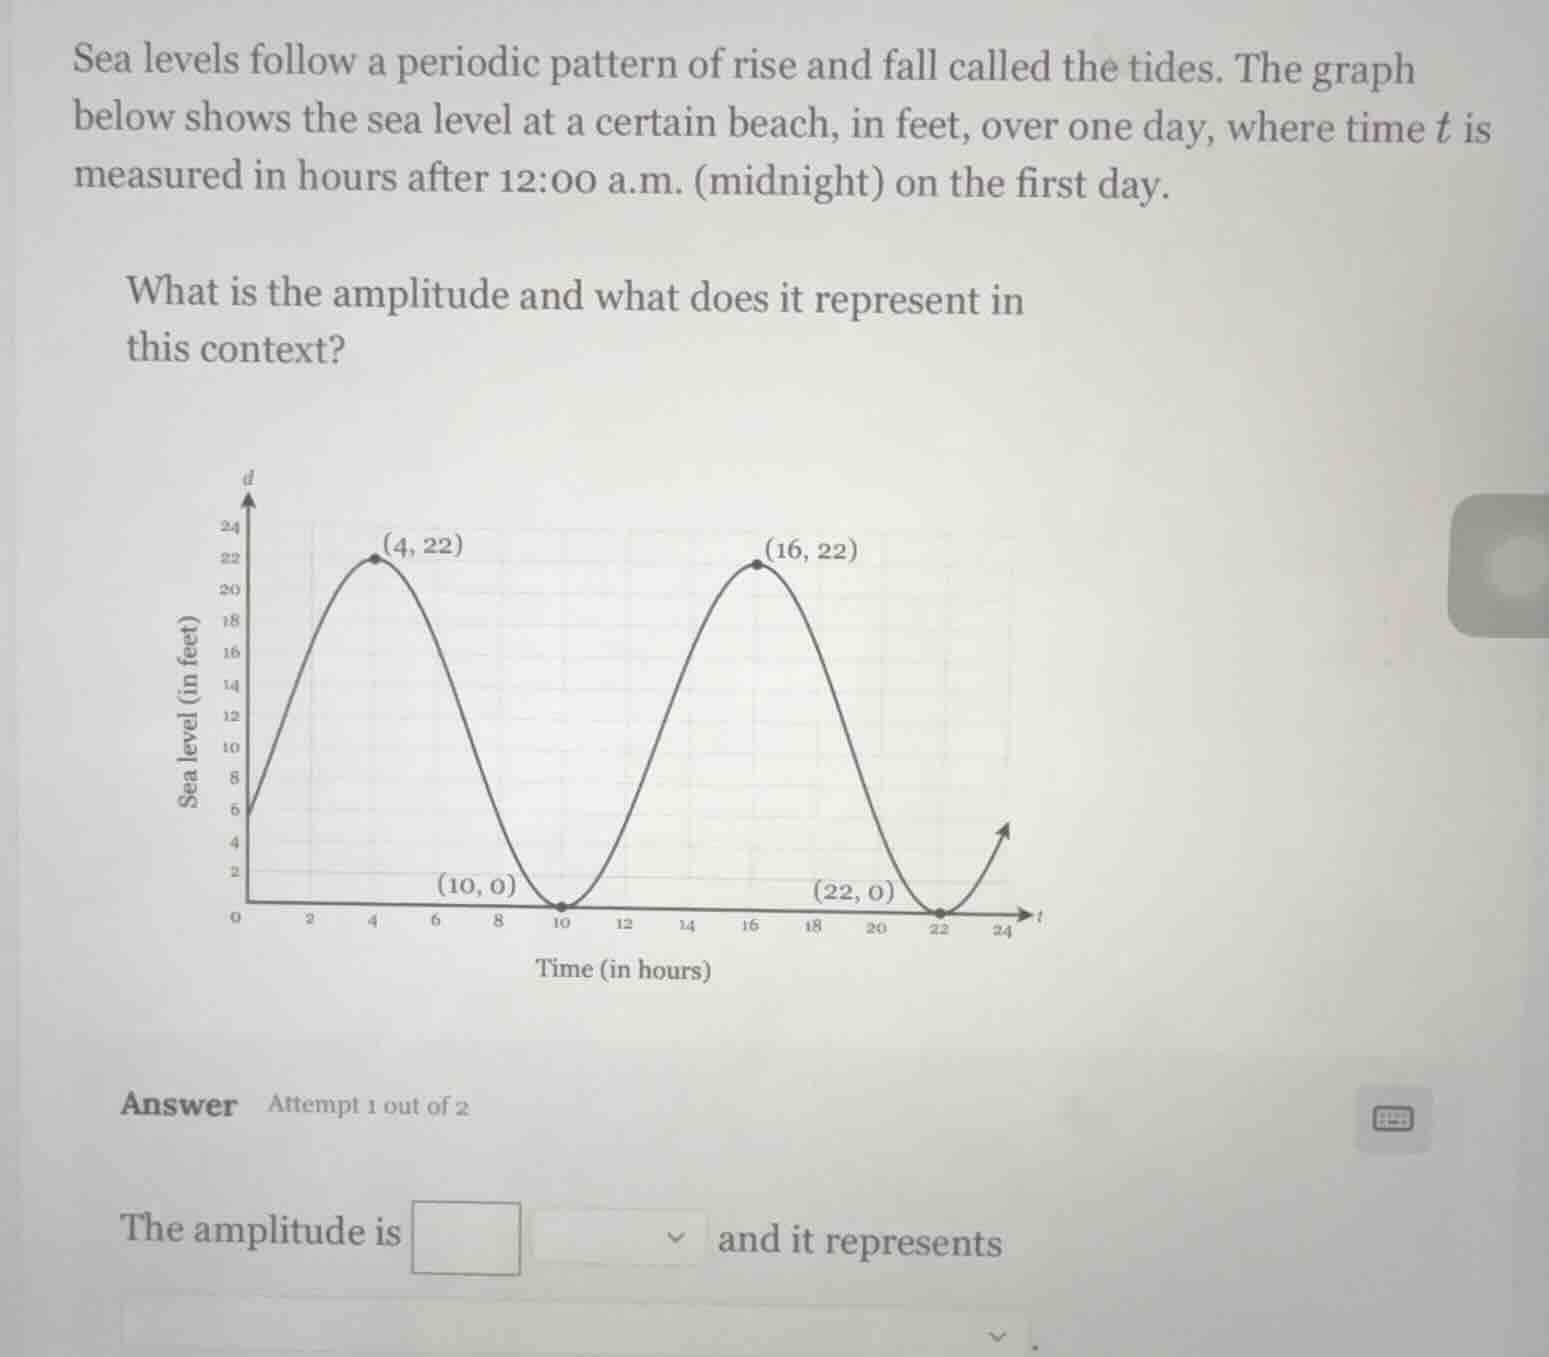
sea levels follow a periodic pattern of rise and fall called the tides. the graph below shows the sea level at a certain beach, in feet, over one day, where time t is measured in hours after 12:00 a.m. (midnight) on the first day. what is the amplitude and what does it represent in this context? the graph has sea level (in feet) on the vertical axis and time (in hours) on the horizontal axis. points on the graph are (0,6), (4,22), (10,0), (16,22), (22,0), and the curve connects these points in a periodic manner. answer attempt 1 out of 2 the amplitude is dropdown and it represents dropdown.
Step1: Find max and min values
Maximum sea level: $22$ ft; Minimum sea level: $0$ ft
Step2: Calculate amplitude
Amplitude = $\frac{\text{Max value} - \text{Min value}}{2}$
$\text{Amplitude} = \frac{22 - 0}{2} = 11$
Step3: Interpret the amplitude
The amplitude is half the total range of sea level change, so it represents the maximum distance the sea level moves above (or below) the average sea level.

Snap & solve any problem in the app
Get step-by-step solutions on Sovi AI
Photo-based solutions with guided steps
Explore more problems and detailed explanations
The amplitude is $11$ feet, and it represents the maximum distance the sea level rises above (or falls below) the average sea level at the beach.