QUESTION IMAGE
Question
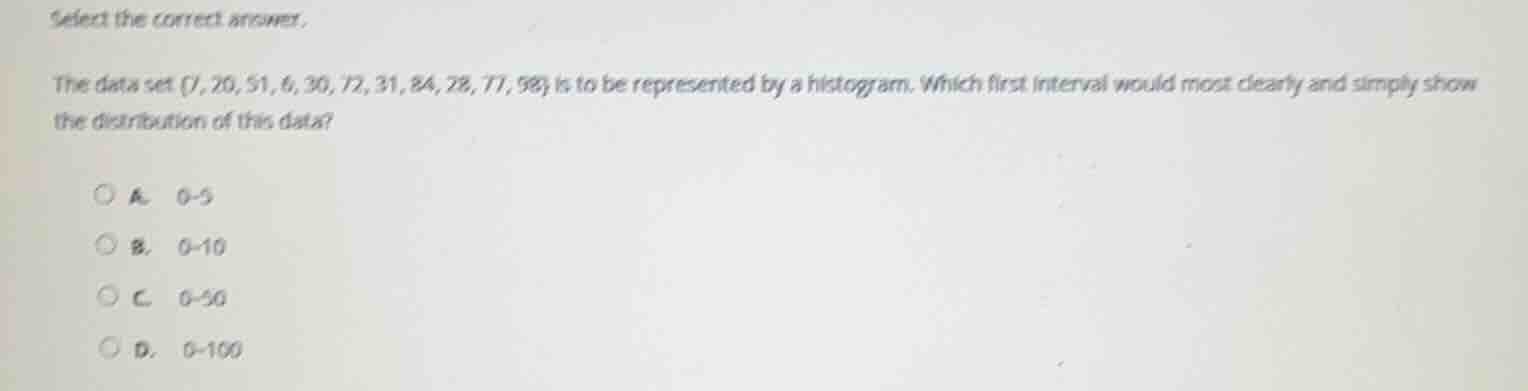
select the correct answer.
the data set {7, 20, 51, 6, 30, 72, 31, 84, 28, 77, 98} is to be represented by a histogram. which first interval would most clearly and simply show the distribution of this data?
a. 0 - 5
b. 0 - 10
c. 0 - 50
d. 0 - 100
Step1: Analyze the data set
The data set is {7, 20, 51, 6, 30, 72, 31, 84, 28, 77, 98}. The minimum value is 6 and the maximum is 98.
Step2: Evaluate each option
- Option A (0 - 5): The data has no values in this interval (minimum is 6), so it's not useful.
- Option B (0 - 10): Values 6 and 7 are in this interval, but other values (like 20, 30, etc.) are outside. It may not show the distribution clearly as many values are in higher ranges.
- Option C (0 - 50): Values 7, 20, 51? Wait, 51 is just above 50. Wait, 7, 20, 6, 30, 28, 31 are in 0 - 50 (51 is 51, so close). But let's check Option D.
- Option D (0 - 100): All values (7, 20, 51, 6, 30, 72, 31, 84, 28, 77, 98) are within 0 - 100. But wait, the question is about the first interval. Wait, maybe I misread. Wait, the first interval for a histogram. Wait, maybe the intervals are consecutive. Wait, no, the question is about which first interval (the starting interval) would most clearly show the distribution. Wait, maybe the intervals are like 0 - 10, 10 - 20, etc. But the options are single intervals. Wait, no, the options are possible first intervals. Wait, let's re - evaluate.
Wait, the data has values from 6 to 98. Option A: 0 - 5 has no data. Option B: 0 - 10 has 6 and 7. Option C: 0 - 50 has 7, 20, 6, 30, 28, 31, 51? No, 51 is outside 0 - 50. Wait, 51 is 51, so 0 - 50 would include up to 50. So 51 is outside. Option D: 0 - 100 includes all data. But a histogram with a single interval 0 - 100 would just be a single bar, which doesn't show distribution. Wait, maybe the question is about the class interval width. Wait, maybe I made a mistake. Wait, let's check the data again. The values are 7, 20, 51, 6, 30, 72, 31, 84, 28, 77, 98.
Wait, maybe the first interval is the left - most interval. Let's see the minimum value is 6. Option A: 0 - 5: no data. Option B: 0 - 10: data points 6 and 7. Option C: 0 - 50: data points 6, 7, 20, 28, 30, 31, 51? No, 51 is 51, so 0 - 50 is up to 50, so 51 is outside. Option D: 0 - 100: all data. But a histogram with a single interval 0 - 100 is not useful. Wait, maybe the question is about the interval that can be the first in a set of intervals. Wait, maybe the intervals are like 0 - 10, 10 - 20, 20 - 30, etc. But the options are given as single intervals. Wait, perhaps the question is misphrased, and it's about the class interval that is appropriate for the first bin.
Wait, let's think again. The data has values from 6 to 98. Option A: 0 - 5: no data. Option B: 0 - 10: has two values. Option C: 0 - 50: has most of the lower - valued data (6, 7, 20, 28, 30, 31) and 51 is just above 50. Option D: 0 - 100: all data, but it's too broad. But wait, maybe the question is about the interval that includes the minimum value and starts at 0. The minimum value is 6, so 0 - 10 includes 6 and 7. But 0 - 50 includes more data (6,7,20,28,30,31,51? No, 51 is 51, so 0 - 50 is up to 50, so 51 is outside). Wait, maybe the question is about the interval that is the most appropriate to start with to show the distribution. Wait, maybe I made a mistake in Option C. Wait, 51 is 51, so 0 - 50: 51 is not in it. But 7, 20, 6, 30, 28, 31 are in 0 - 50. Option D: 0 - 100 includes all, but it's too wide. Wait, the question says "most clearly and simply show the distribution". If we take 0 - 10 as the first interval, then the next intervals would be 10 - 20, 20 - 30, etc. But the options are single intervals. Wait, maybe the question is about which interval (as the first one) contains the most relevant data. Wait, no. Wait, let's check the values again. The data points: 6…

Snap & solve any problem in the app
Get step-by-step solutions on Sovi AI
Photo-based solutions with guided steps
Explore more problems and detailed explanations
B. 0 - 10