QUESTION IMAGE
Question
select the correct answer.
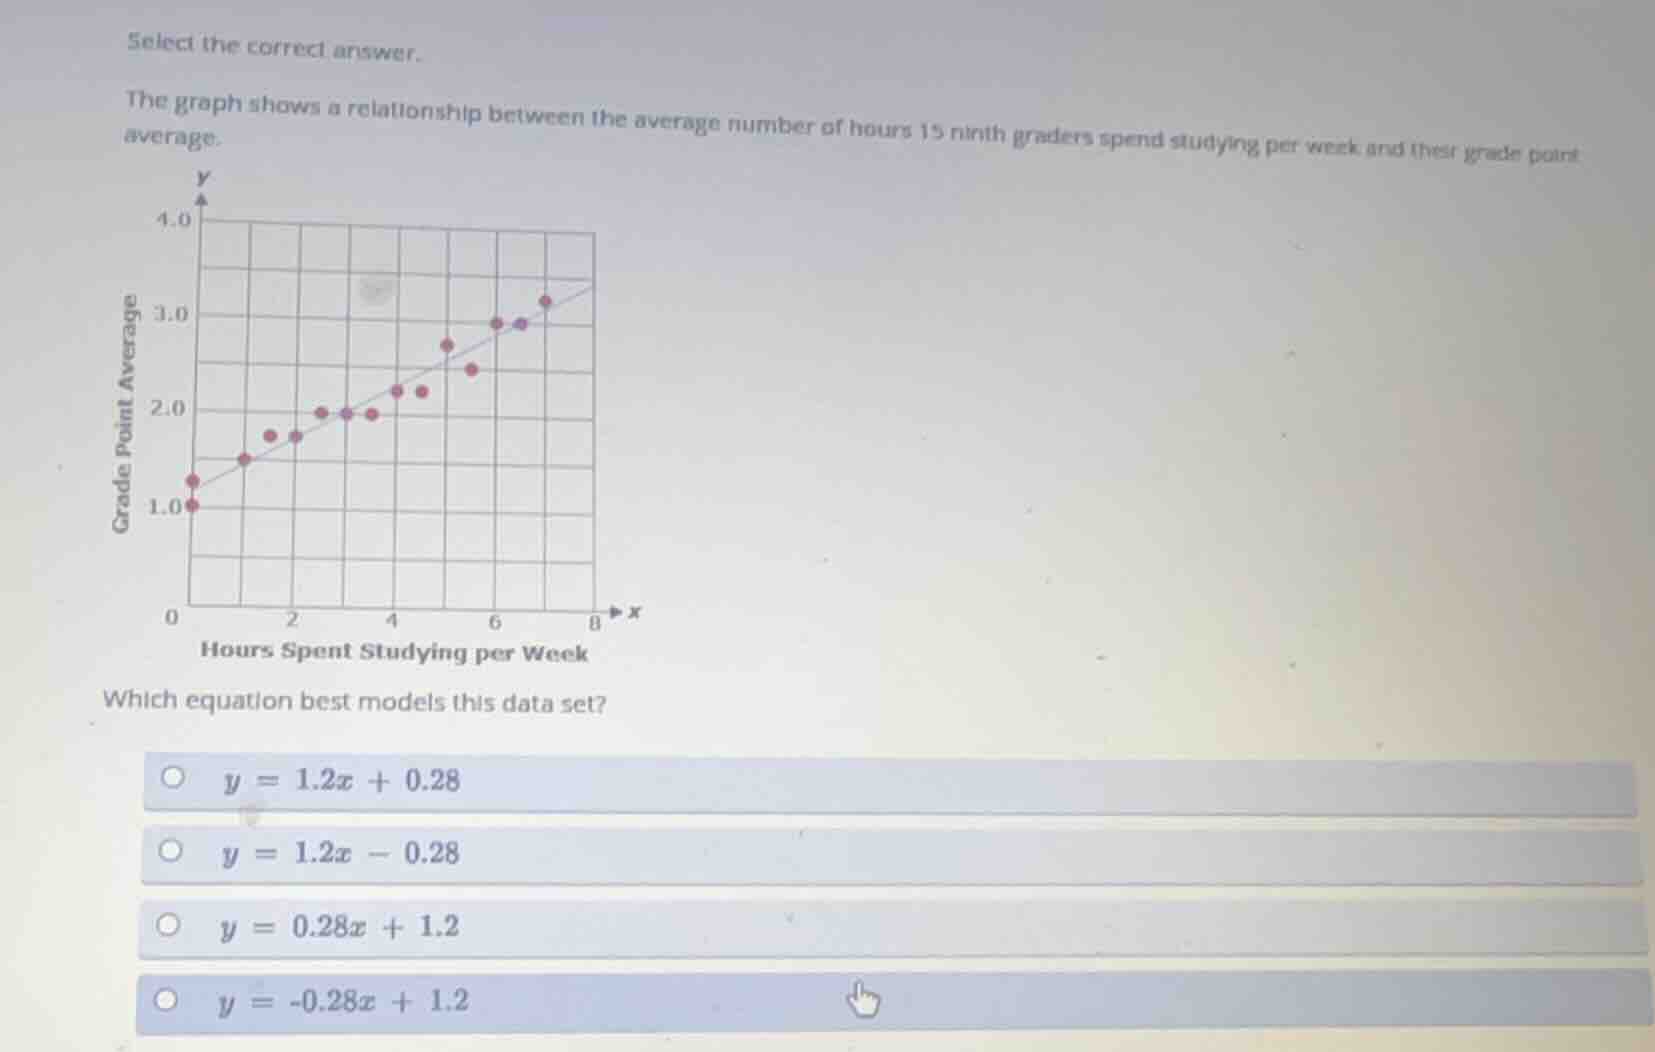
the graph shows a relationship between the average number of hours 15 ninth graders spend studying per week and their grade point average.
which equation best models this data set?
- $y = 1.2x + 0.28$
- $y = 1.2x - 0.28$
- $y = 0.28x + 1.2$
- $y = -0.28x + 1.2$
Step1: Identify y-intercept trend
The line crosses the y-axis near $y=1.2$, so the constant term is ~1.2.
Step2: Check slope sign
Data has positive correlation, so slope is positive. Eliminate negative slope option.
Step3: Calculate approximate slope
Use points $(0,1.2)$ and $(8,3.3)$:
$\text{slope} = \frac{3.3 - 1.2}{8 - 0} = \frac{2.1}{8} = 0.2625 \approx 0.28$
Step4: Match to equation
Slope ~0.28, y-intercept ~1.2, so equation is $y=0.28x+1.2$.

Snap & solve any problem in the app
Get step-by-step solutions on Sovi AI
Photo-based solutions with guided steps
Explore more problems and detailed explanations
$y = 0.28x + 1.2$