QUESTION IMAGE
Question
2
select the correct answer
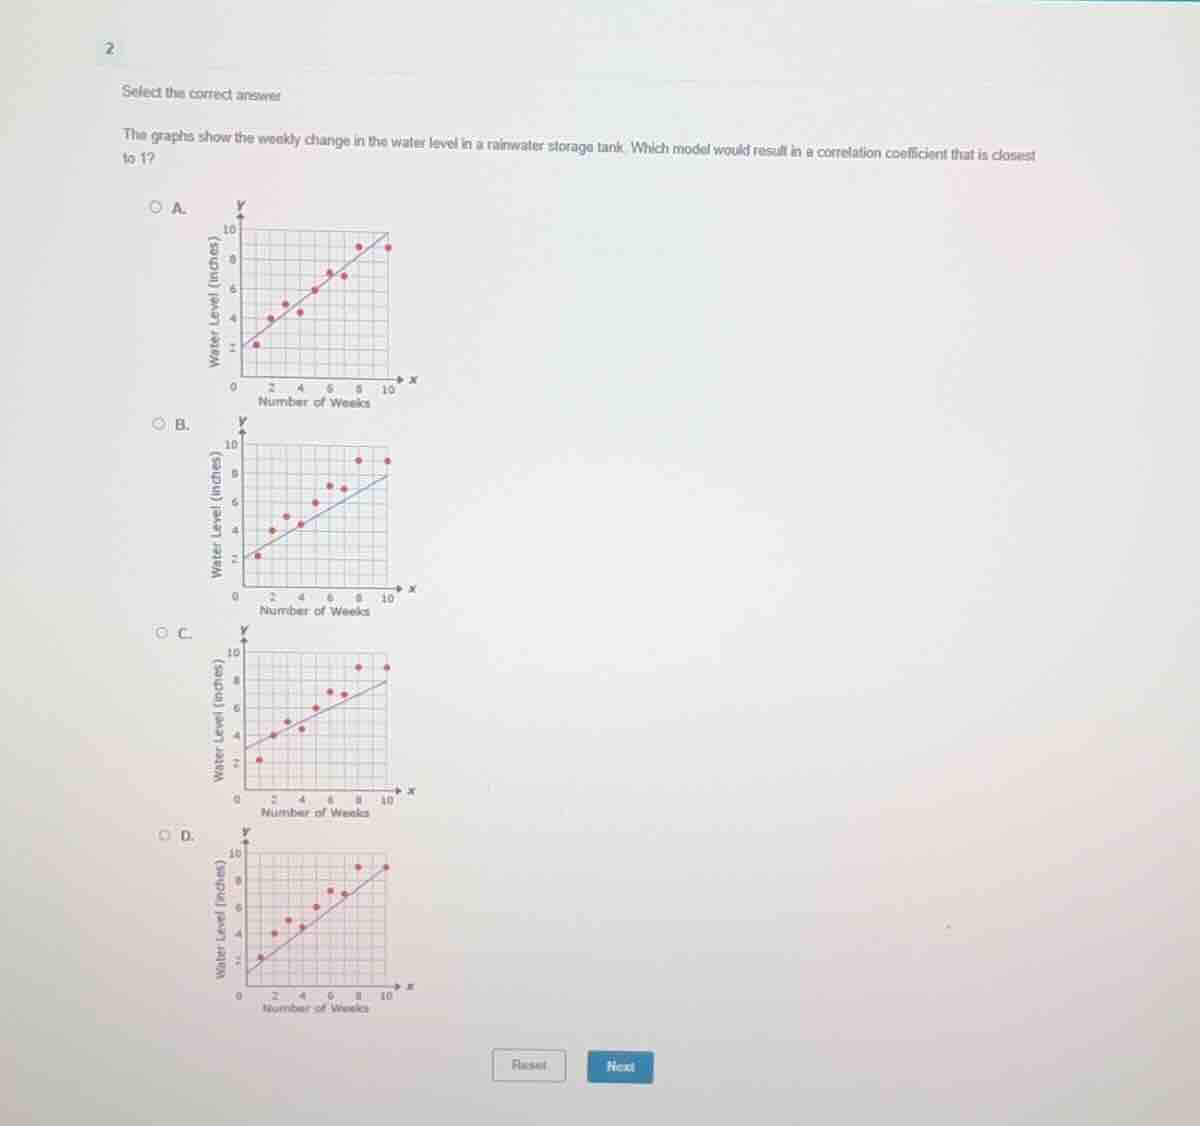
the graphs show the weekly change in the water level in a rainwater storage tank. which model would result in a correlation coefficient that is closest to 1?
a.
graph a: scatter plot with line, x-axis number of weeks, y-axis water level (inches)
b.
graph b: scatter plot with line, x-axis number of weeks, y-axis water level (inches)
c.
graph c: scatter plot with line, x-axis number of weeks, y-axis water level (inches)
d.
graph d: scatter plot with line, x-axis number of weeks, y-axis water level (inches)
reset next
A correlation coefficient close to 1 indicates a strong positive linear relationship. Among the options, the points in Graph A are most tightly clustered around the trend line, reflecting the strongest linear association.

Snap & solve any problem in the app
Get step-by-step solutions on Sovi AI
Photo-based solutions with guided steps
Explore more problems and detailed explanations
A. [Graph A showing points closest to a straight line]