QUESTION IMAGE
Question
semester 1 unit 4 exam review
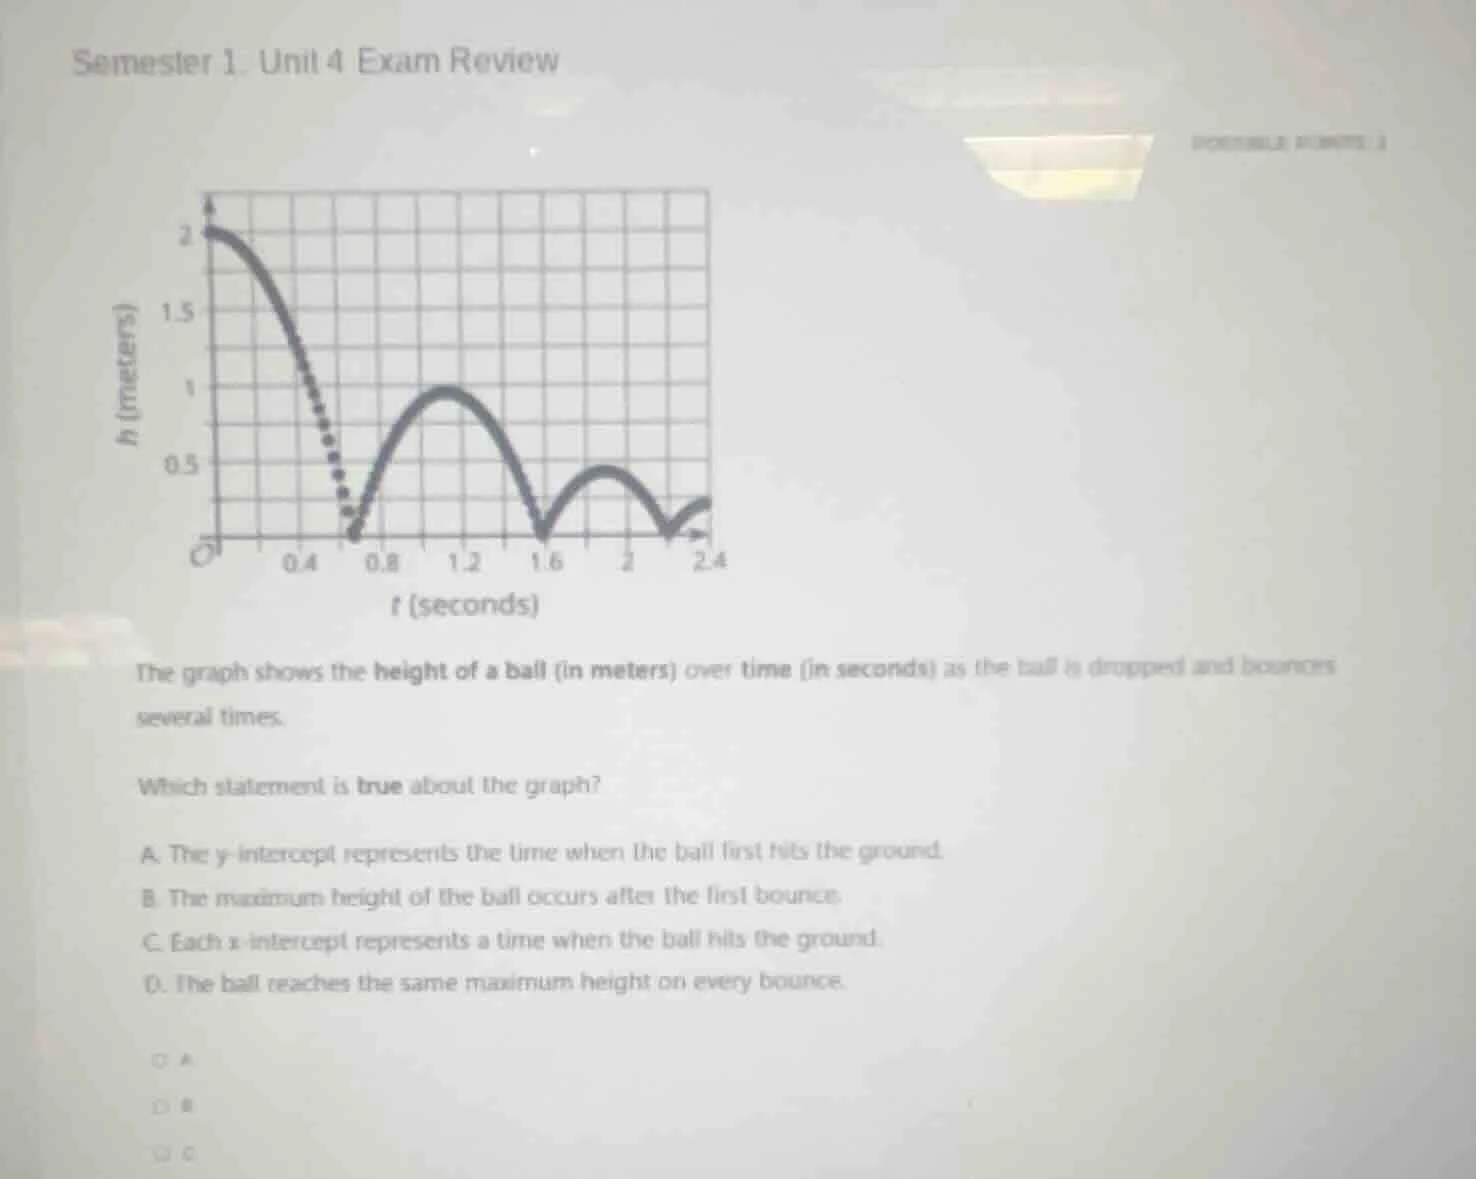
the graph shows the height of a ball (in meters) over time (in seconds) as the ball is dropped and bounces several times.
which statement is true about the graph?
a. the y - intercept represents the time when the ball first hits the ground.
b. the maximum height of the ball occurs after the first bounce.
c. each x - intercept represents a time when the ball hits the ground.
d. the ball reaches the same maximum height on every bounce.
Brief Explanations
- Option A: The y-intercept is at \(t=0\), \(h=2\) meters, which is the initial height of the ball, not when it hits the ground. So A is false.
- Option B: The highest peak is at \(t=0\) (initial drop), not after the first bounce. So B is false.
- Option C: X-intercepts occur where \(h=0\) meters, which is when the ball makes contact with the ground. This is true.
- Option D: The maximum heights of each bounce decrease over time, so they are not the same. So D is false.

Snap & solve any problem in the app
Get step-by-step solutions on Sovi AI
Photo-based solutions with guided steps
Explore more problems and detailed explanations
C. Each x-intercept represents a time when the ball hits the ground.