QUESTION IMAGE
Question
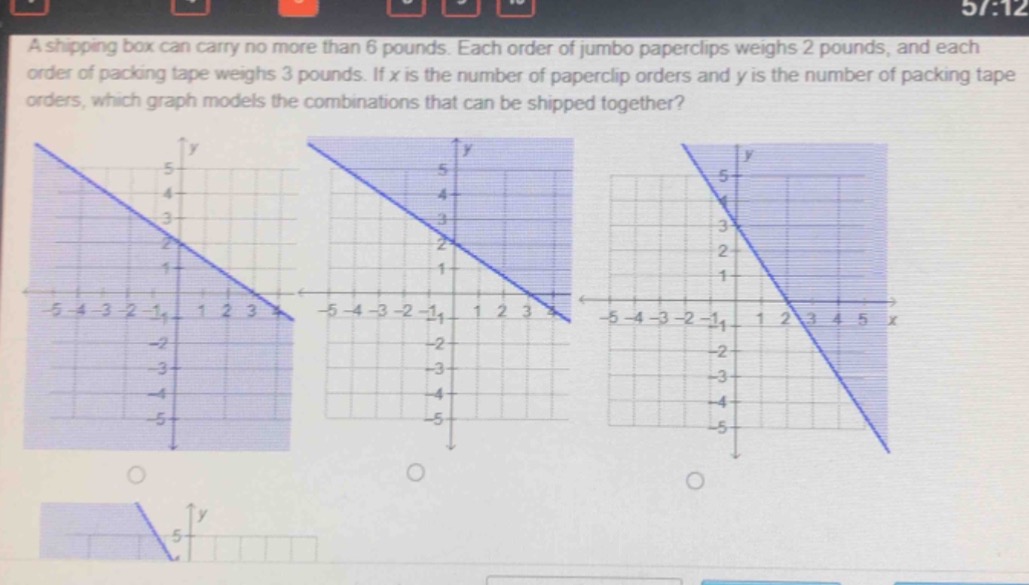
a shipping box can carry no more than 6 pounds. each order of jumbo paperclips weighs 2 pounds, and each order of packing tape weighs 3 pounds. if x is the number of paperclip orders and y is the number of packing tape orders, which graph models the combinations that can be shipped together?
Step1: Define inequality for weight limit
Each paperclip order is 2 lbs, packing tape is 3 lbs. Total weight ≤ 6 lbs:
$$2x + 3y \leq 6$$
Step2: Find intercepts of boundary line
Set $x=0$: $3y=6 \implies y=2$. Set $y=0$: $2x=6 \implies x=3$. Boundary line connects $(0,2)$ and $(3,0)$.
Step3: Test origin for shaded region
Substitute $(0,0)$ into $2x+3y \leq6$: $0 \leq6$, which is true. Shade region containing the origin.
Step4: Verify non-negative values
$x,y$ are counts, so $x\geq0, y\geq0$. Valid region is in first quadrant, below the line.

Snap & solve any problem in the app
Get step-by-step solutions on Sovi AI
Photo-based solutions with guided steps
Explore more problems and detailed explanations
The correct graph is the middle one (with boundary line connecting (0,2) and (3,0), shaded region below the line including the origin and first quadrant values).