QUESTION IMAGE
Question
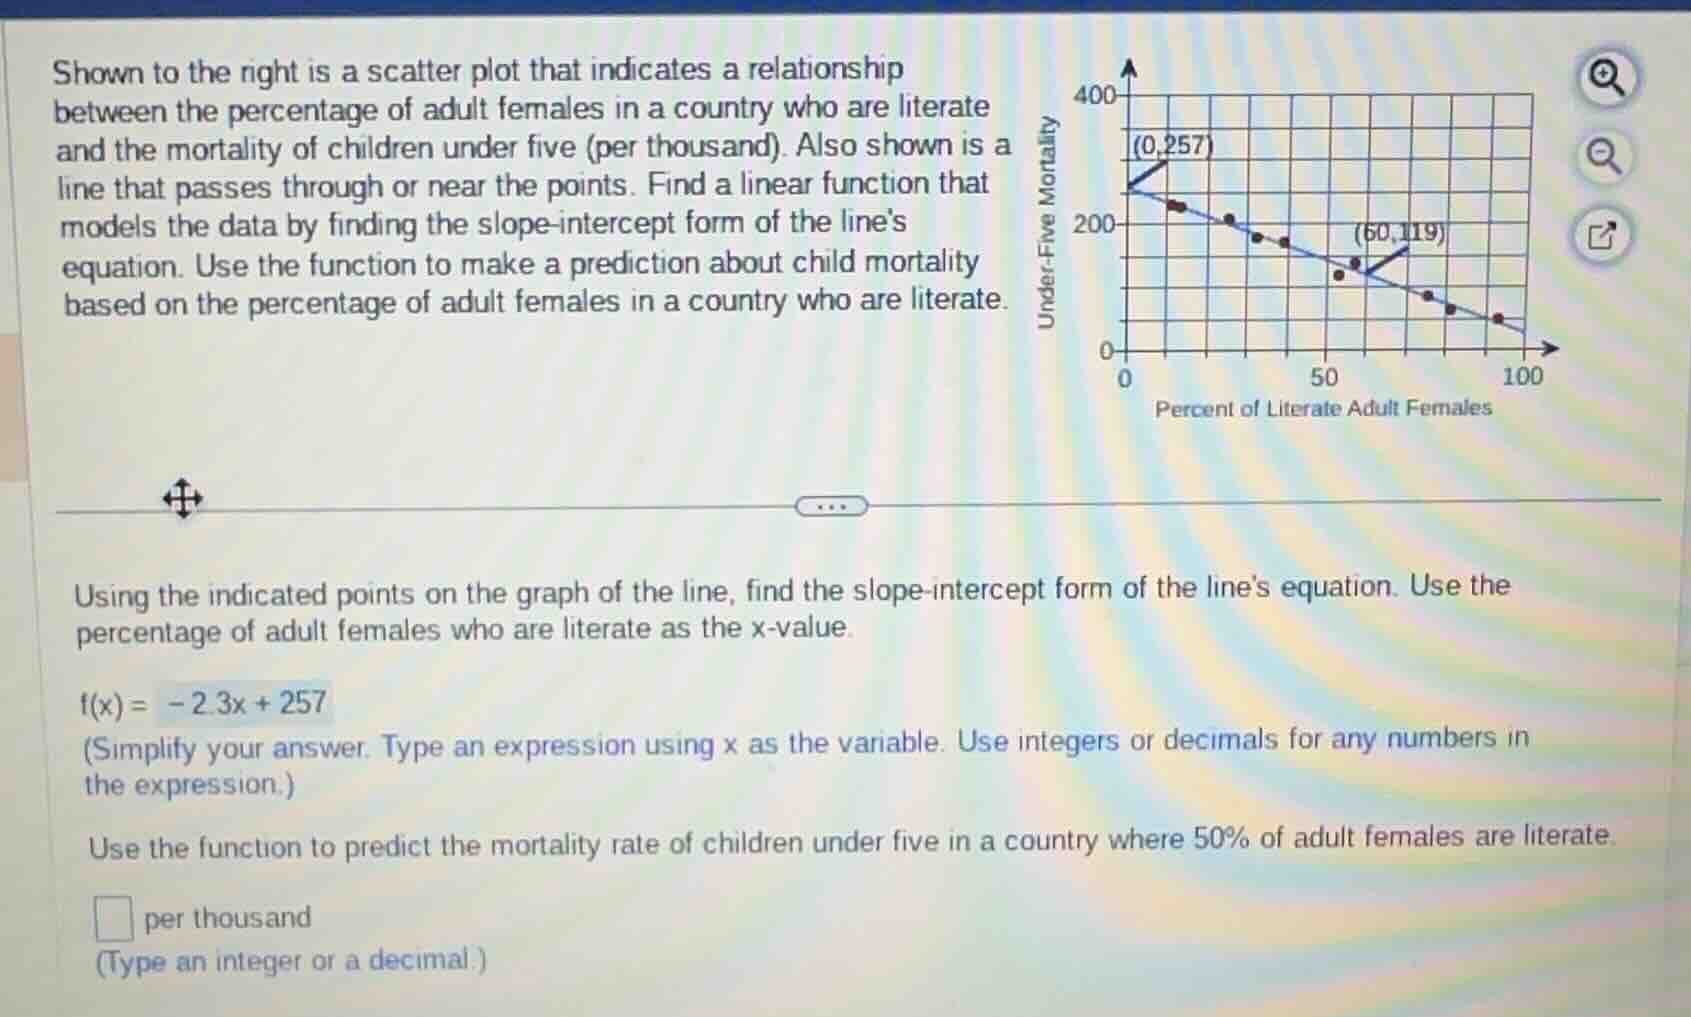
shown to the right is a scatter plot that indicates a relationship between the percentage of adult females in a country who are literate and the mortality of children under five (per thousand). also shown is a line that passes through or near the points. find a linear function that models the data by finding the slope-intercept form of the lines equation. use the function to make a prediction about child mortality based on the percentage of adult females in a country who are literate.
using the indicated points on the graph of the line, find the slope-intercept form of the lines equation. use the percentage of adult females who are literate as the x-value.
$f(x)= -2.3x + 257$
(simplify your answer. type an expression using x as the variable. use integers or decimals for any numbers in the expression.)
use the function to predict the mortality rate of children under five in a country where 50% of adult females are literate.
$square$ per thousand
(type an integer or a decimal.)
Step1: Identify given function
The linear function is $f(x) = -2.3x + 257$, where $x$ is the percentage of literate adult females.
Step2: Substitute $x=50$ into function
Substitute the value to calculate mortality:
$f(50) = -2.3(50) + 257$
Step3: Compute the result
First calculate the product: $-2.3\times50 = -115$
Then add to the intercept: $-115 + 257 = 142$

Snap & solve any problem in the app
Get step-by-step solutions on Sovi AI
Photo-based solutions with guided steps
Explore more problems and detailed explanations
142 per thousand