QUESTION IMAGE
Question
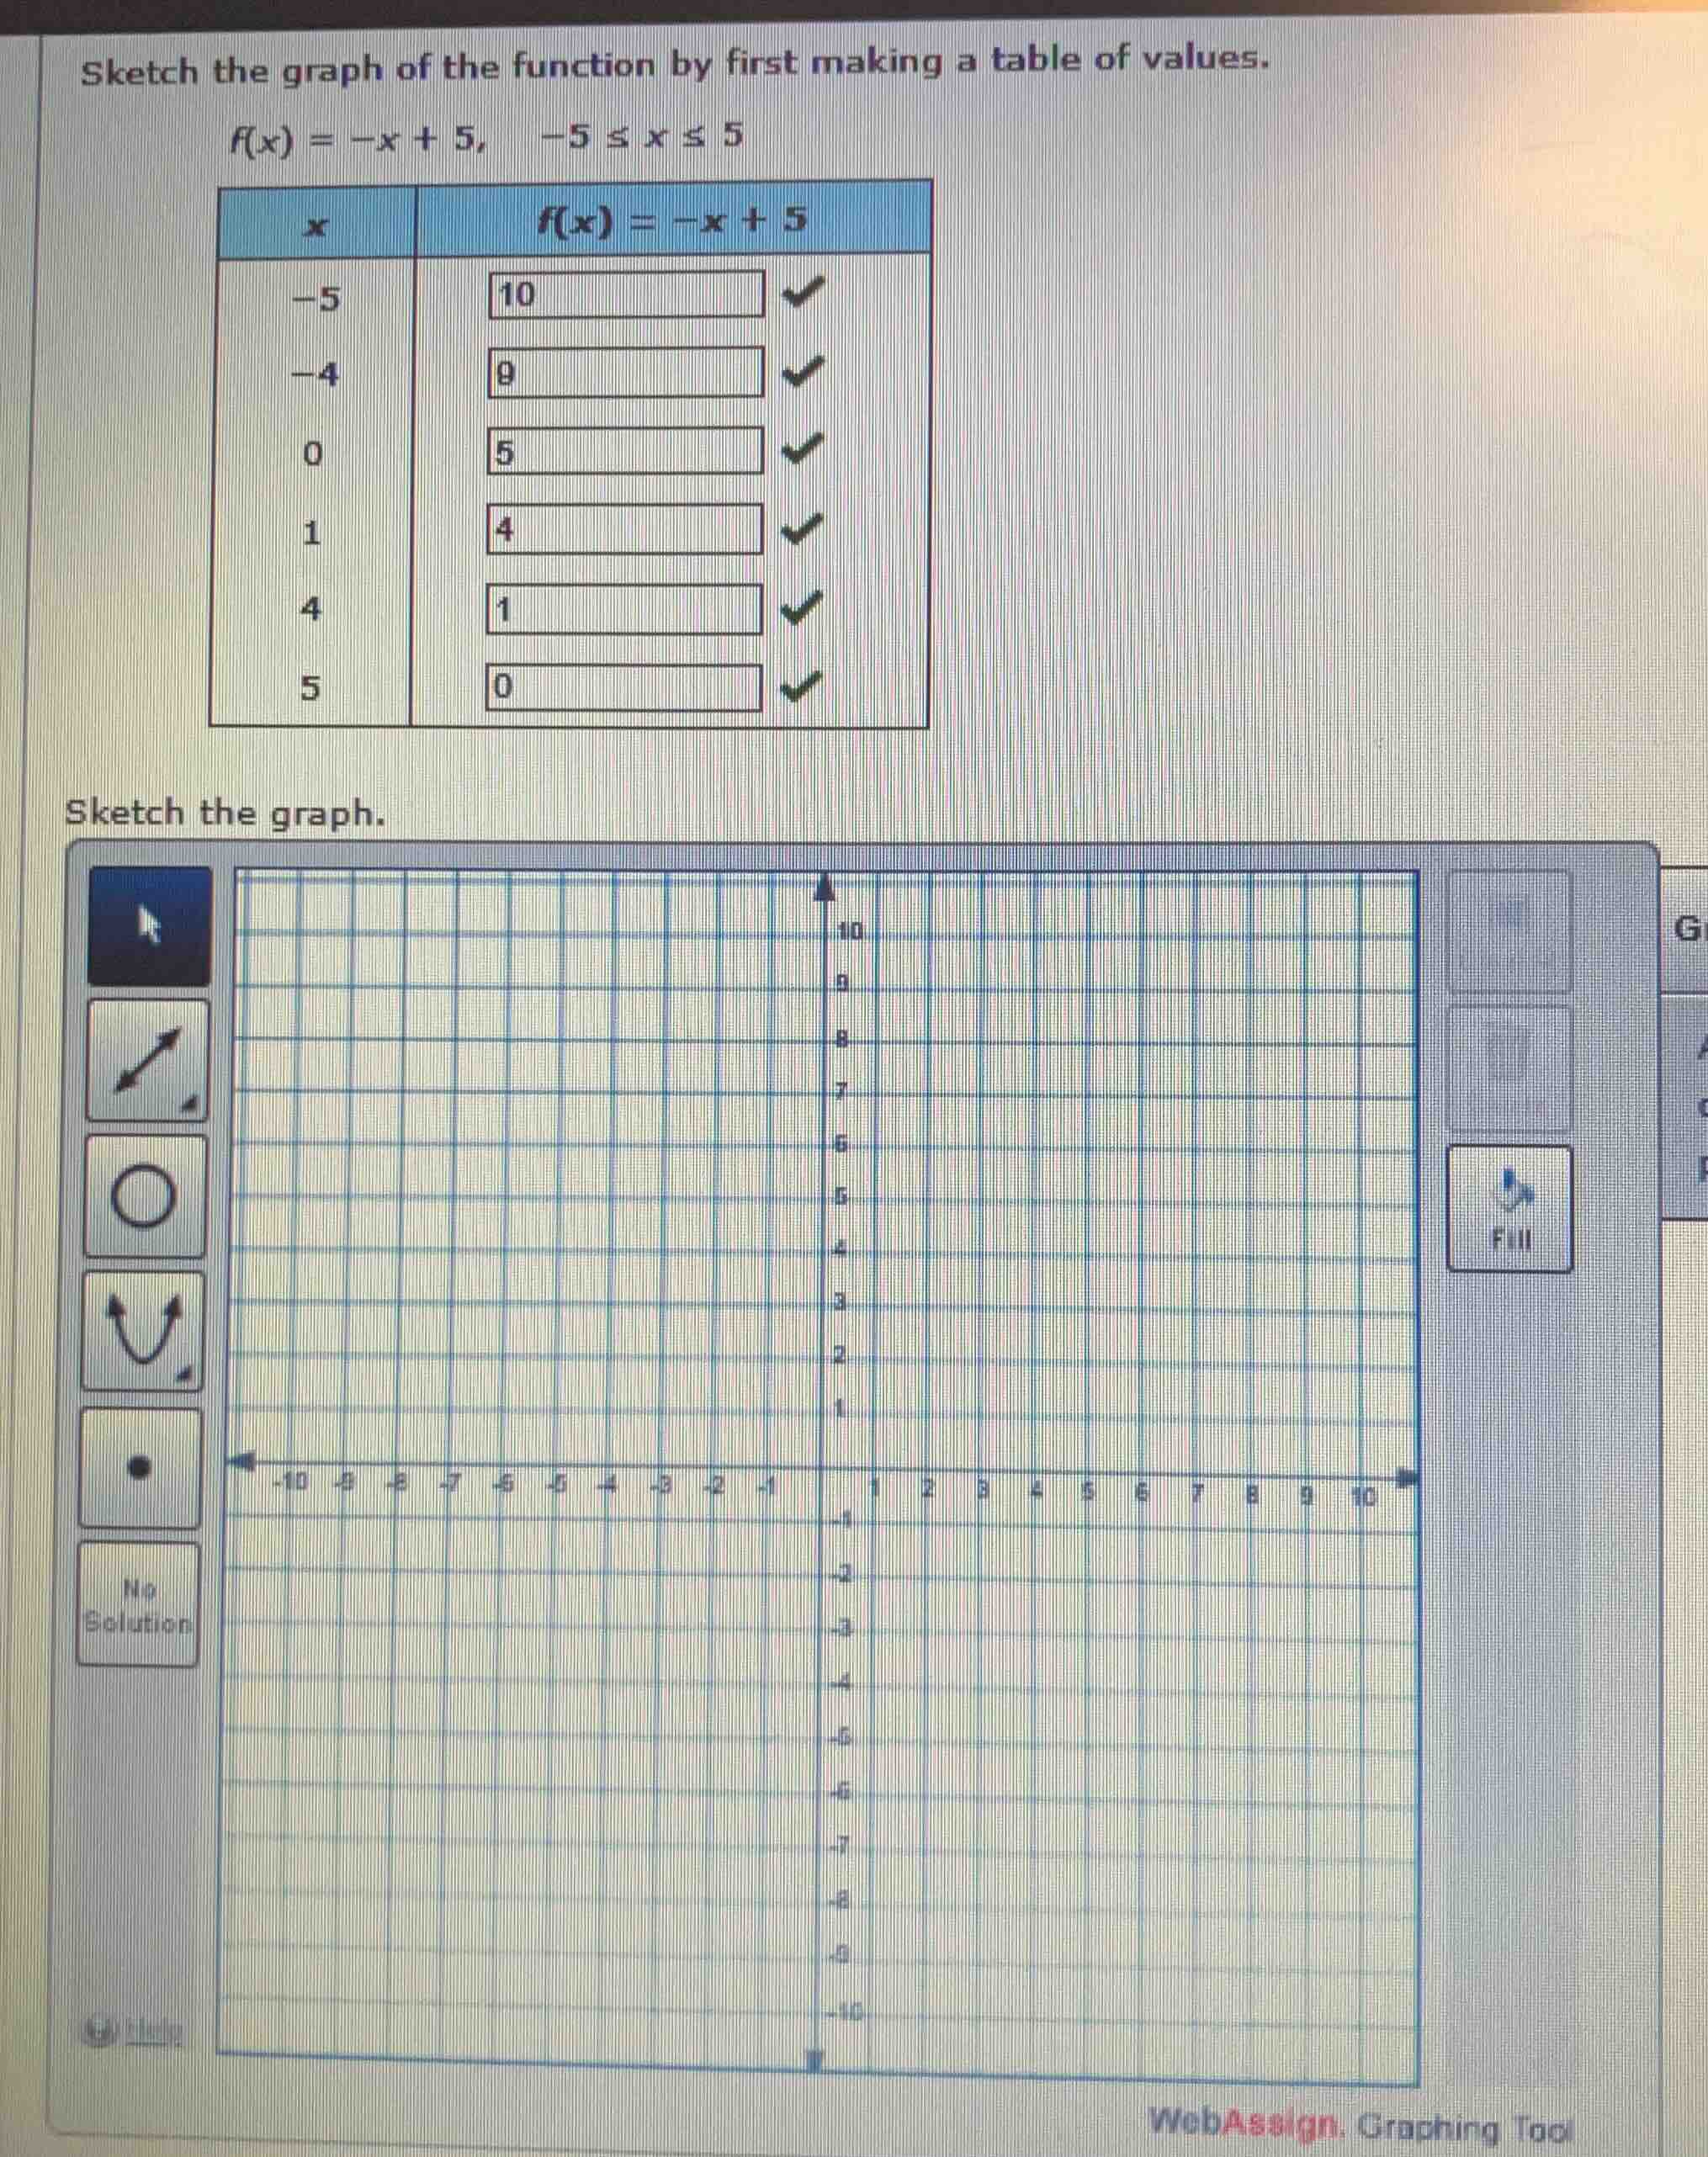
sketch the graph of the function by first making a table of values.
$f(x) = -x + 5, \\ \\ -5 \leq x \leq 5$
| $x$ | $f(x) = -x + 5$ |
|---|---|
| $-4$ | $9$ |
| $0$ | $5$ |
| $1$ | $4$ |
| $4$ | $1$ |
| $5$ | $0$ |
sketch the graph.
Step1: Identify Points from Table
We have the function \( f(x)=-x + 5 \) with \( x \) values \(-5,-4,0,1,4,5\) and corresponding \( f(x) \) values \( 10,9,5,4,1,0 \). So the points are \((-5,10)\), \((-4,9)\), \((0,5)\), \((1,4)\), \((4,1)\), \((5,0)\).
Step2: Plot Points on Graph
- For \( x=-5 \), \( y = 10 \): Locate \( x=-5 \) on the x - axis and \( y = 10 \) on the y - axis, mark the point \((-5,10)\).
- For \( x=-4 \), \( y = 9 \): Locate \( x=-4 \) and \( y = 9 \), mark \((-4,9)\).
- For \( x = 0 \), \( y=5 \): Mark \((0,5)\) (the y - intercept).
- For \( x = 1 \), \( y = 4 \): Mark \((1,4)\).
- For \( x = 4 \), \( y=1 \): Mark \((4,1)\).
- For \( x = 5 \), \( y = 0 \): Mark \((5,0)\) (the x - intercept when \( y = 0 \)).
Step3: Draw the Line
Since \( f(x)=-x + 5 \) is a linear function (in the form \( y=mx + b \) where \( m=-1 \) and \( b = 5 \)), we draw a straight line passing through all the plotted points. The slope \( m=-1 \) means for every 1 unit increase in \( x \), \( y \) decreases by 1 unit, which is consistent with the table values (e.g., from \( x=-5 \) to \( x=-4 \), \( x \) increases by 1, \( y \) decreases from 10 to 9).

Snap & solve any problem in the app
Get step-by-step solutions on Sovi AI
Photo-based solutions with guided steps
Explore more problems and detailed explanations
To sketch the graph:
- Plot the points \((-5,10)\), \((-4,9)\), \((0,5)\), \((1,4)\), \((4,1)\), \((5,0)\) on the coordinate plane.
- Draw a straight line passing through these points. The line has a slope of \(-1\) and a y - intercept at \((0,5)\).