QUESTION IMAGE
Question
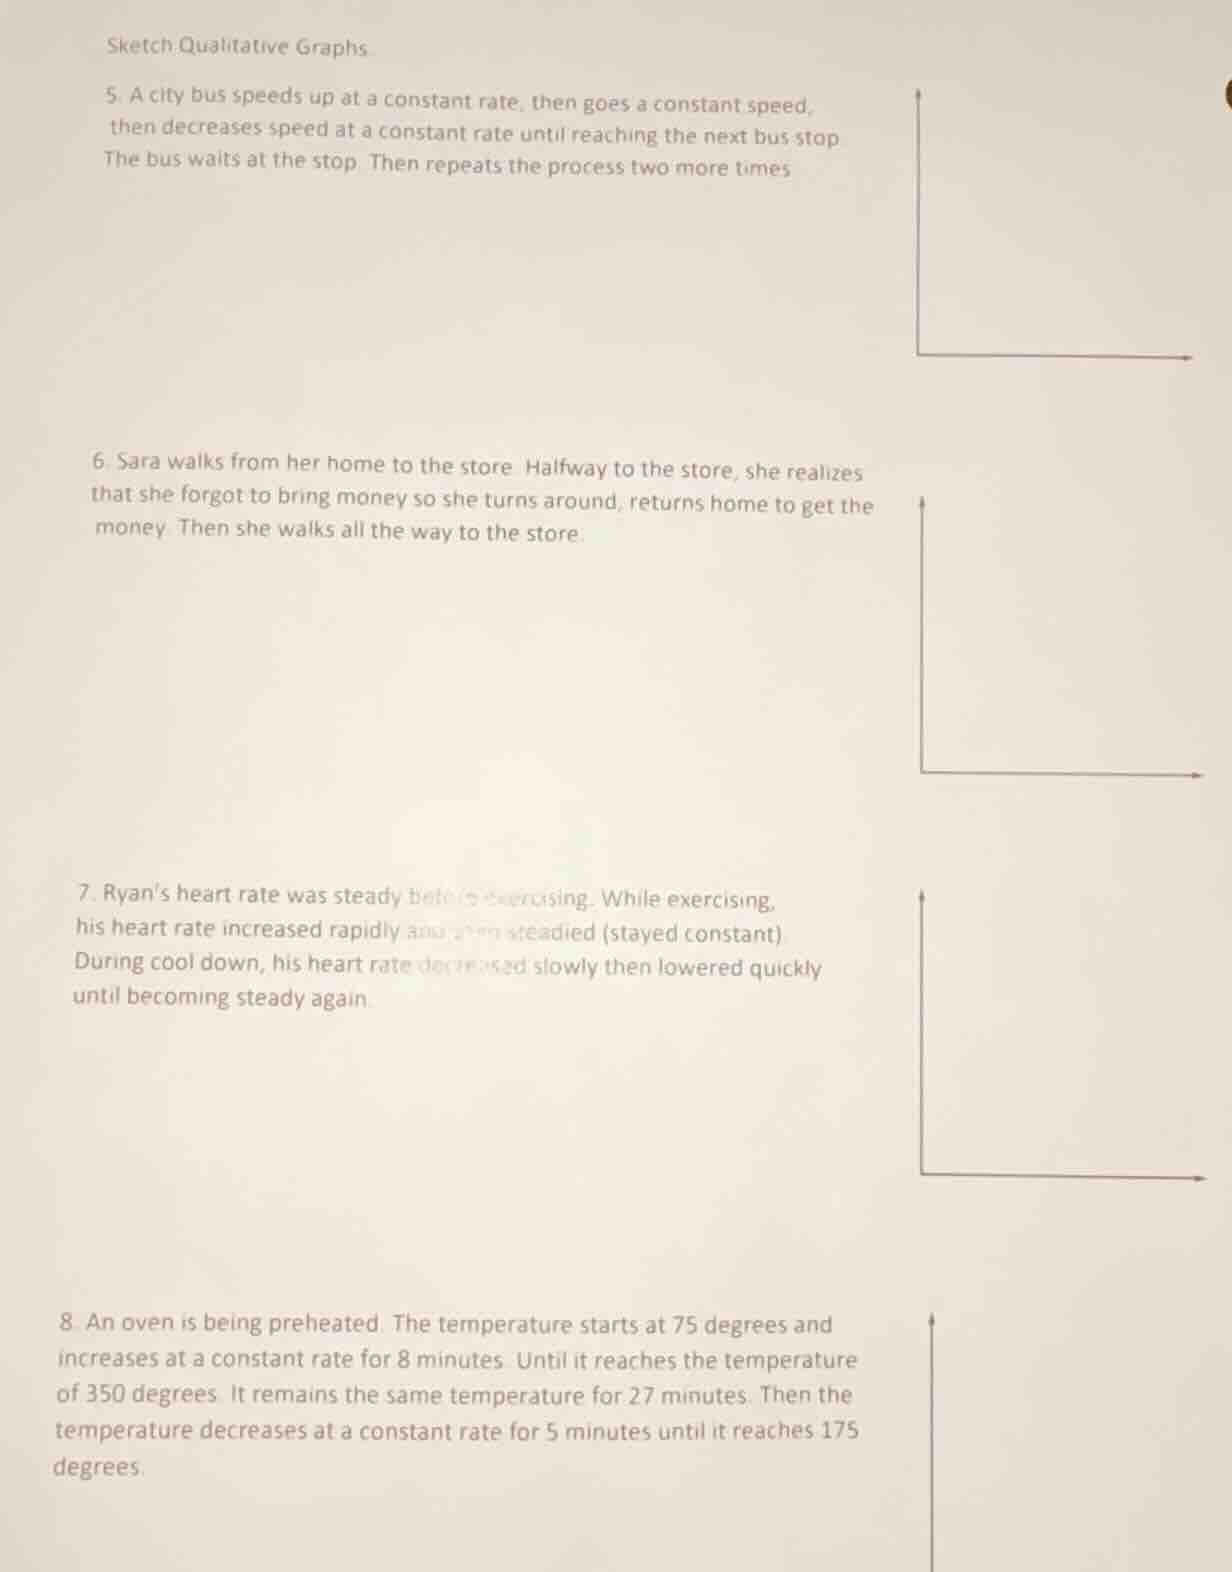
sketch qualitative graphs
- a city bus speeds up at a constant rate, then goes a constant speed,
then decreases speed at a constant rate until reaching the next bus stop
the bus waits at the stop. then repeats the process two more times
- sara walks from her home to the store. halfway to the store, she realizes
that she forgot to bring money so she turns around, returns home to get the
money. then she walks all the way to the store.
- ryan’s heart rate was steady before exercising. while exercising,
his heart rate increased rapidly and then steadied (stayed constant).
during cool down, his heart rate decreased slowly then lowered quickly
until becoming steady again
- an oven is being preheated. the temperature starts at 75 degrees and
increases at a constant rate for 8 minutes. until it reaches the temperature
of 350 degrees. it remains the same temperature for 27 minutes. then the
temperature decreases at a constant rate for 5 minutes until it reaches 175
degrees.
Problem 5: City Bus Motion Graph
Step1: Define Axes
Let the x - axis represent time (\(t\)) and the y - axis represent speed (\(v\)).
Step2: First Cycle
- Speeding up: The speed increases linearly with time (since it's a constant rate of speeding up). So the graph is a line with a positive slope from \((0,0)\) (assuming initial speed is 0) until it reaches the constant speed \(v_1\) at time \(t_1\).
- Constant speed: The speed remains constant, so the graph is a horizontal line (slope = 0) from \(t = t_1\) to \(t = t_2\) (when it starts to slow down).
- Slowing down: The speed decreases linearly with time (constant rate of deceleration) until it reaches 0 at time \(t_3\) (when it reaches the bus stop).
- Waiting at stop: The speed is 0, so the graph is a horizontal line (slope = 0) from \(t = t_3\) to \(t = t_4\) (when it starts moving again).
Step3: Repeat the Cycle
Repeat the above three phases (speeding up, constant speed, slowing down, waiting) two more times. The overall graph will have three cycles of the speeding - constant - slowing - waiting pattern.
Problem 6: Sara's Walk Graph
Step1: Define Axes
Let the x - axis represent time (\(t\)) and the y - axis represent distance from home (\(d\)).
Step2: First Part (Walking to store halfway)
- Sara starts at \(d = 0\) (home) and walks towards the store. The distance from home increases linearly with time (constant speed) until she reaches \(d=\frac{D}{2}\) (where \(D\) is the total distance to the store) at time \(t_1\).
Step3: Returning Home
- She turns around and walks back home. The distance from home decreases linearly with time (same speed as before, but opposite direction) until she reaches \(d = 0\) at time \(t_2\) (where \(t_2>t_1\) since she has to cover the same distance \(\frac{D}{2}\) back).
Step4: Walking to Store Again
- She then walks from home (\(d = 0\)) to the store (\(d = D\)) at a constant speed. The distance from home increases linearly with time until she reaches \(d = D\) at time \(t_3\) (where \(t_3>t_2\)).
Problem 7: Ryan's Heart Rate Graph
Step1: Define Axes
Let the x - axis represent time (\(t\)) and the y - axis represent heart rate (\(hr\)).
Step2: Before Exercising
- His heart rate is steady, so the graph is a horizontal line (slope = 0) from \(t = 0\) to \(t = t_1\) (when he starts exercising).
Step3: During Exercising
- Increasing rapidly: The heart rate increases rapidly (steeper positive slope) until it reaches a constant rate \(hr_1\) at time \(t_2\).
- Steady during exercise: The heart rate remains constant, so the graph is a horizontal line (slope = 0) from \(t = t_2\) to \(t = t_3\) (when he starts cooling down).
Step4: During Cool Down
- Decreasing slowly: The heart rate decreases slowly (gentle negative slope) until time \(t_4\).
- Decreasing quickly: The heart rate decreases quickly (steeper negative slope) until it reaches the initial steady heart rate at time \(t_5\).
Problem 8: Oven Temperature Graph

Snap & solve any problem in the app
Get step-by-step solutions on Sovi AI
Photo-based solutions with guided steps
Explore more problems and detailed explanations
Step1: Define Axes
Let the x - axis represent time (\(t\)) and the y - axis represent temperature (\(T\)) in degrees.
Step2: Preheating (Increasing Temperature)
- The temperature starts at \(T = 75\) degrees and increases at a constant rate for 8 minutes. The temperature as a function of time is \(T(t)=75 + rt\), where \(r\) is the rate of temperature increase. At \(t = 8\) minutes, \(T(8)=350\) degrees. So \(350=75 + 8r\), and \(r=\frac{350 - 75}{8}=\frac{275}{8}=34.375\) degrees per minute. The graph is a line with slope \(r\) from \(t = 0\) to \(t = 8\).
Step3: Constant Temperature
- The temperature remains at 350 degrees for 27 minutes. So the graph is a horizontal line (slope = 0) from \(t = 8\) to \(t=8 + 27=35\) minutes.
Step4: Decreasing Temperature
- The temperature decreases at a constant rate for 5 minutes until it reaches 175 degrees. The rate of decrease \(r_d=\frac{350 - 175}{5}=\frac{175}{5} = 35\) degrees per minute. The temperature as a function of time is \(T(t)=350-35(t - 35)\) for \(t\) from 35 to \(35 + 5=40\) minutes. The graph is a line with slope \(- 35\) from \(t = 35\) to \(t = 40\) minutes.
(Note: Since the problem asks to sketch the graphs, the above explanations describe the shape of the graphs. If we were to draw them, we would plot the points according to the time - dependent relationships described above.)