QUESTION IMAGE
Question
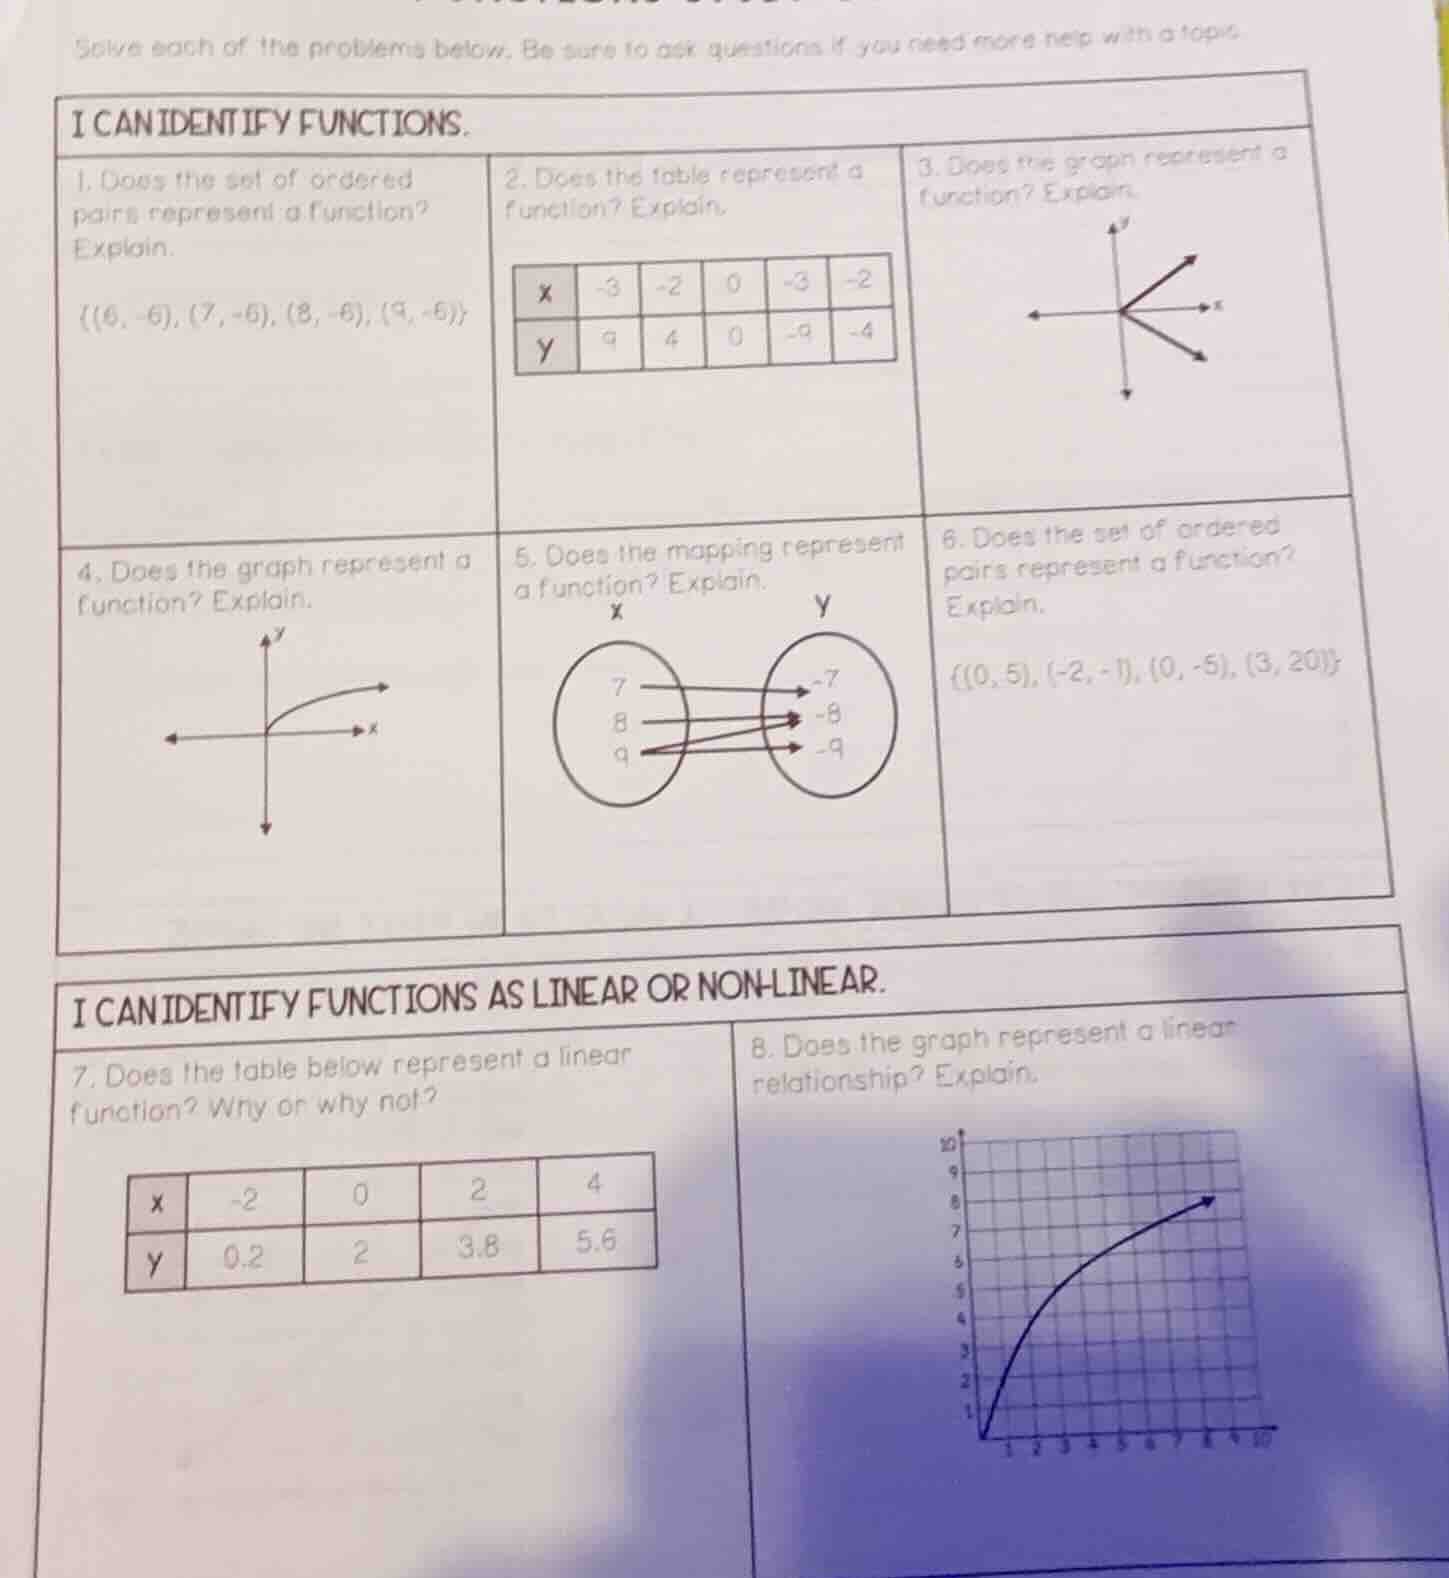
solve each of the problems below. be sure to ask questions if you need more help with a topic.
i can identify functions.
- does the set of ordered pairs represent a function? explain.
{(6, -6), (7, -6), (8, -6), (9, -6)}
- does the table represent a function? explain.
| x | -3 | -2 | 0 | -3 | -2 |
| y | 9 | 4 | 0 | -9 | -4 |
- does the graph represent a function? explain.
(graph of a v - shaped graph with vertex at the origin, opening to the right and down)
- does the graph represent a function? explain.
(graph of a curve starting at the origin and curving upwards to the right)
- does the mapping represent a function? explain.
(mapping diagram with x - set: 7, 8, 9; y - set: -7, -8, -9. 7 maps to -7, 8 maps to -8, -9; 9 maps to -7, -8, -9)
- does the set of ordered pairs represent a function? explain.
{(0, 5), (-2, -1), (0, -5), (3, 20)}
i can identify functions as linear or non - linear.
- does the table below represent a linear function? why or why not?
| x | -2 | 0 | 2 | 4 |
| y | 0.2 | 2 | 3.8 | 5.6 |
- does the graph represent a linear relationship? explain.
(graph of a curve starting at the origin and curving upwards, getting less steep as x increases)
Step1: Check 1st ordered pairs
A function has unique x-values. All x-values (6,7,8,9) are unique.
Step2: Check 2nd table x-values
x-values: -3,-2,0,-3,-2. -3 and -2 repeat.
Step3: Check 3rd graph (Vertical Line Test)
A vertical line intersects 2+ points.
Step4: Check 4th graph (Vertical Line Test)
Any vertical line intersects at most 1 point.
Step5: Check 5th mapping x-values
Each x (7,8,9) maps to 1 y-value.
Step6: Check 6th ordered pairs
x-values: 0,-2,0,3. 0 repeats.
Step7: Check 7th table rate of change
Calculate $\Delta y/\Delta x$:
$\frac{2-0.2}{0-(-2)}=\frac{1.8}{2}=0.9$; $\frac{3.8-2}{2-0}=\frac{1.8}{2}=0.9$; $\frac{5.6-3.8}{4-2}=\frac{1.8}{2}=0.9$
Constant rate of change.
Step8: Check 8th graph linearity
Graph is a curve, not straight line.

Snap & solve any problem in the app
Get step-by-step solutions on Sovi AI
Photo-based solutions with guided steps
Explore more problems and detailed explanations
- Yes; all x-values are unique.
- No; x-values -3 and -2 repeat (one x maps to two y-values).
- No; fails Vertical Line Test (a vertical line intersects multiple points).
- Yes; passes Vertical Line Test (each x has one y).
- Yes; each x maps to exactly one y-value.
- No; x-value 0 repeats (maps to 5 and -5).
- Yes; constant rate of change ($\frac{\Delta y}{\Delta x}=0.9$) between all points.
- No; the graph is a curved line, not straight.