QUESTION IMAGE
Question
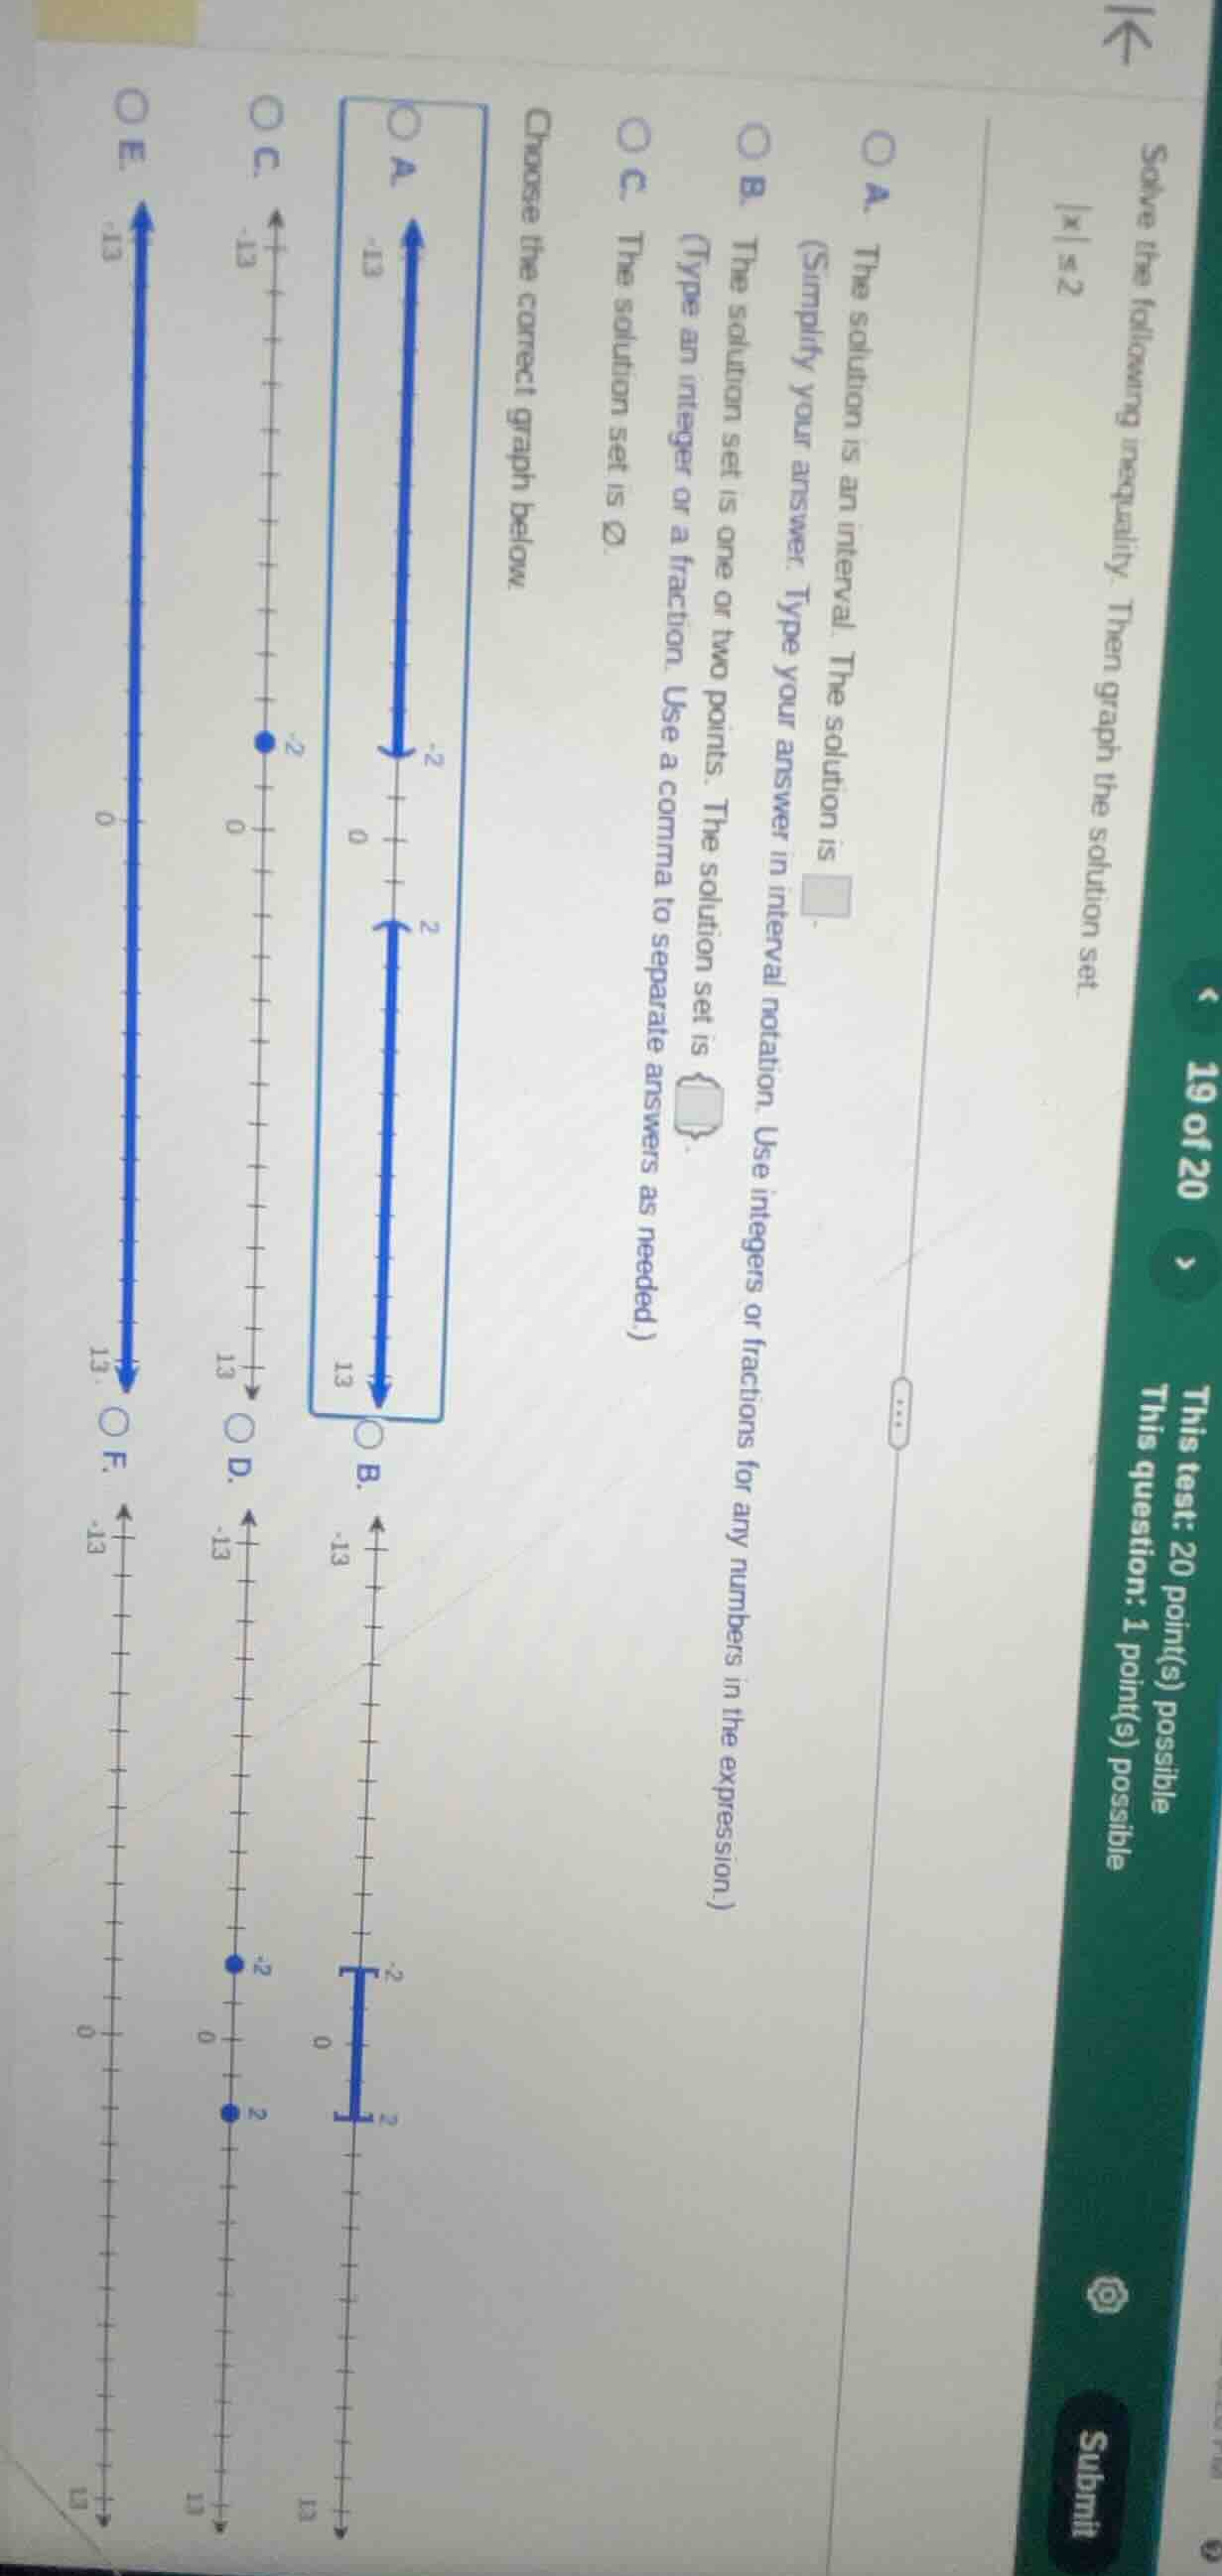
solve the following inequality. then graph the solution set.
|x| ≤ 2
a. the solution is an interval. the solution is
(simplify your answer. type your answer in interval notation. use integers or fractions for any numbers in the expression.)
b. the solution set is one or two points. the solution set is
(type an integer or a fraction. use a comma to separate answers as needed.)
c. the solution set is ∅.
choose the correct graph below.
(graph options a - f are shown with number lines from -13 to 13, some with arrows, dots, or brackets at -2 and 2)
Step1: Recall absolute value inequality
The absolute value inequality \(|x| \leq 2\) means that \(x\) is between \(-2\) and \(2\) (inclusive). In interval notation, this is written as \([-2, 2]\).
Step2: Analyze the graphs
We need to find the graph that shows all real numbers from \(-2\) to \(2\), including the endpoints. Looking at the options, graph C (assuming the description of graph C has a filled dot at \(-2\) and \(2\) and a line connecting them) represents the interval \([-2, 2]\). But first, let's confirm the solution interval.
For \(|x| \leq 2\), by the definition of absolute value, we have \(-2 \leq x \leq 2\), which in interval notation is \([-2, 2]\).

Snap & solve any problem in the app
Get step-by-step solutions on Sovi AI
Photo-based solutions with guided steps
Explore more problems and detailed explanations
The solution in interval notation is \([-2, 2]\). For the graph, the correct one should have filled circles at \(-2\) and \(2\) and a line segment connecting them (matching option C's description if it has those features).