QUESTION IMAGE
Question
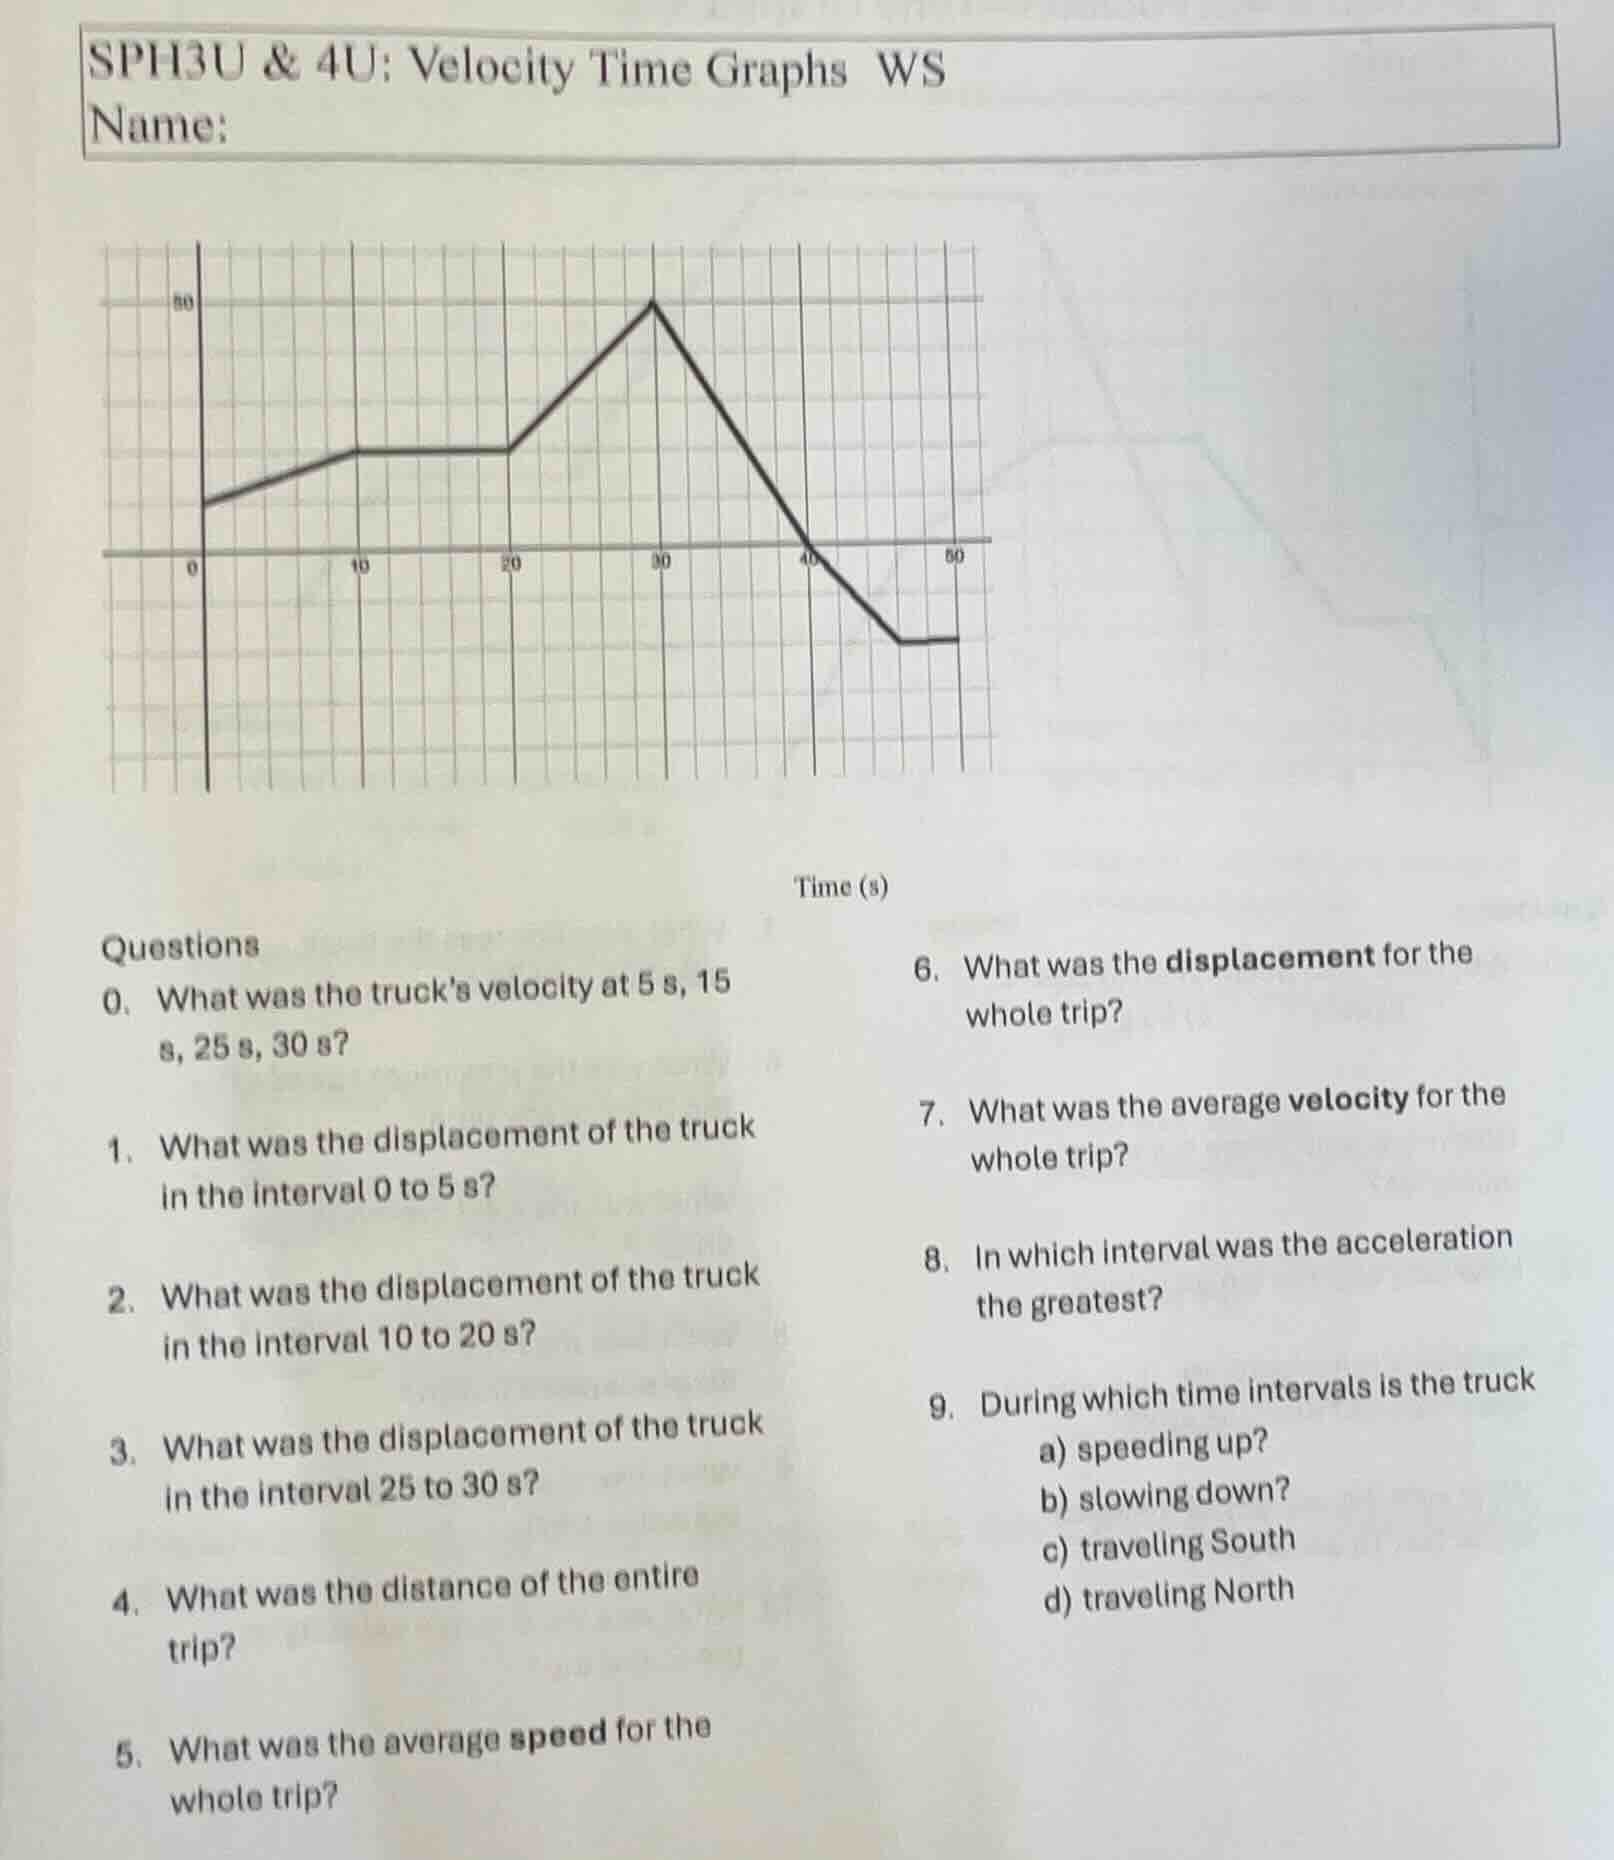
sph3u & 4u: velocity time graphs ws
name:
time (s)
questions
- what was the trucks velocity at 5 s, 15 s, 25 s, 30 s?
- what was the displacement of the truck in the interval 0 to 5 s?
- what was the displacement of the truck in the interval 10 to 20 s?
- what was the displacement of the truck in the interval 25 to 30 s?
- what was the distance of the entire trip?
- what was the average speed for the whole trip?
- what was the displacement for the whole trip?
- what was the average velocity for the whole trip?
- in which interval was the acceleration the greatest?
- during which time intervals is the truck
a) speeding up?
b) slowing down?
c) traveling south
d) traveling north
To solve these velocity - time graph problems, we use the following key concepts:
- Velocity at a time: Read the velocity value from the graph at the specific time.
- Displacement in an interval: The area under the velocity - time graph for that interval. If the velocity is positive, the area above the time - axis is displacement; if negative, the area below the time - axis is displacement (but we consider the sign for displacement, while for distance we take the absolute value of the area).
- Average velocity: Total displacement divided by total time.
- Average speed: Total distance divided by total time.
- Acceleration: The slope of the velocity - time graph. A steeper slope means greater acceleration (in magnitude).
- Speeding up/slowing down: If the velocity and acceleration have the same sign, the object is speeding up; if opposite signs, slowing down. The direction (North/South) is determined by the sign of velocity (positive for North, negative for South, assuming North is positive direction).
Question 0: What was the truck’s velocity at 5 s, 15 s, 25 s, 30 s?
Step 1: Velocity at 5 s
From the graph, at \(t = 5\space s\), we look at the y - axis (velocity) value. Let's assume the grid has a certain scale. If we assume each grid square has a velocity of, say, 5 m/s (we need to estimate from the graph). At \(t = 5\space s\), the velocity is approximately \(10\space m/s\) (depending on the graph's scale. Let's assume the initial velocity at \(t = 0\) is \(5\space m/s\), and it's increasing. At \(t = 5\space s\), it's around \(10\space m/s\)).
Step 2: Velocity at 15 s
At \(t=15\space s\), the graph is flat (constant velocity) at a value, let's say, \(20\space m/s\) (from the graph's horizontal line from \(t = 10\) to \(t = 20\)).
Step 3: Velocity at 25 s
At \(t = 25\space s\), the velocity is the same as at \(t = 15\space s\) (since the graph is flat from \(t = 10\) to \(t = 20\) and then starts increasing, but at \(t=25\space s\), it's still at the constant value from \(t = 10 - 20\), so \(v=20\space m/s\)).
Step 4: Velocity at 30 s
At \(t = 30\space s\), the graph reaches a peak. Let's assume the peak velocity is \(60\space m/s\) (from the graph's peak at \(t = 30\space s\)).
Question 1: What was the displacement of the truck in the interval 0 to 5 s?
Step 1: Identify the shape of the graph in 0 - 5 s
The graph from \(t = 0\) to \(t = 5\space s\) is a trapezoid or a triangle - like shape (a line with positive slope). The formula for the area of a trapezoid is \(A=\frac{(v_0 + v_5)}{2}\times\Delta t\), where \(v_0\) is velocity at \(t = 0\), \(v_5\) is velocity at \(t = 5\space s\), and \(\Delta t=5 - 0=5\space s\).
If \(v_0 = 5\space m/s\) and \(v_5 = 10\space m/s\), then \(A=\frac{(5 + 10)}{2}\times5=\frac{15}{2}\times5 = 37.5\space m\)
Question 2: What was the displacement of the truck in the interval 10 to 20 s?
Step 1: Identify the shape of the graph in 10 - 20 s
The graph from \(t = 10\) to \(t = 20\space s\) is a horizontal line (constant velocity). The formula for the area of a rectangle (since velocity is constant) is \(A=v\times\Delta t\), where \(v\) is the constant velocity and \(\Delta t=20 - 10 = 10\space s\).
If \(v = 20\space m/s\) (from the graph), then \(A=20\times10=200\space m\)
Question 3: What was the displacement of the truck in the interval 25 to 30 s?
Step 1: Identify the shape of the graph in 25 - 30 s
The graph from \(t = 20\) to \(t = 30\space s\) is a line with positive slope. Let's find the velocity at \(t = 20\space s\) (w…

Snap & solve any problem in the app
Get step-by-step solutions on Sovi AI
Photo-based solutions with guided steps
Explore more problems and detailed explanations
To solve these velocity - time graph problems, we use the following key concepts:
- Velocity at a time: Read the velocity value from the graph at the specific time.
- Displacement in an interval: The area under the velocity - time graph for that interval. If the velocity is positive, the area above the time - axis is displacement; if negative, the area below the time - axis is displacement (but we consider the sign for displacement, while for distance we take the absolute value of the area).
- Average velocity: Total displacement divided by total time.
- Average speed: Total distance divided by total time.
- Acceleration: The slope of the velocity - time graph. A steeper slope means greater acceleration (in magnitude).
- Speeding up/slowing down: If the velocity and acceleration have the same sign, the object is speeding up; if opposite signs, slowing down. The direction (North/South) is determined by the sign of velocity (positive for North, negative for South, assuming North is positive direction).
Question 0: What was the truck’s velocity at 5 s, 15 s, 25 s, 30 s?
Step 1: Velocity at 5 s
From the graph, at \(t = 5\space s\), we look at the y - axis (velocity) value. Let's assume the grid has a certain scale. If we assume each grid square has a velocity of, say, 5 m/s (we need to estimate from the graph). At \(t = 5\space s\), the velocity is approximately \(10\space m/s\) (depending on the graph's scale. Let's assume the initial velocity at \(t = 0\) is \(5\space m/s\), and it's increasing. At \(t = 5\space s\), it's around \(10\space m/s\)).
Step 2: Velocity at 15 s
At \(t=15\space s\), the graph is flat (constant velocity) at a value, let's say, \(20\space m/s\) (from the graph's horizontal line from \(t = 10\) to \(t = 20\)).
Step 3: Velocity at 25 s
At \(t = 25\space s\), the velocity is the same as at \(t = 15\space s\) (since the graph is flat from \(t = 10\) to \(t = 20\) and then starts increasing, but at \(t=25\space s\), it's still at the constant value from \(t = 10 - 20\), so \(v=20\space m/s\)).
Step 4: Velocity at 30 s
At \(t = 30\space s\), the graph reaches a peak. Let's assume the peak velocity is \(60\space m/s\) (from the graph's peak at \(t = 30\space s\)).
Question 1: What was the displacement of the truck in the interval 0 to 5 s?
Step 1: Identify the shape of the graph in 0 - 5 s
The graph from \(t = 0\) to \(t = 5\space s\) is a trapezoid or a triangle - like shape (a line with positive slope). The formula for the area of a trapezoid is \(A=\frac{(v_0 + v_5)}{2}\times\Delta t\), where \(v_0\) is velocity at \(t = 0\), \(v_5\) is velocity at \(t = 5\space s\), and \(\Delta t=5 - 0=5\space s\).
If \(v_0 = 5\space m/s\) and \(v_5 = 10\space m/s\), then \(A=\frac{(5 + 10)}{2}\times5=\frac{15}{2}\times5 = 37.5\space m\)
Question 2: What was the displacement of the truck in the interval 10 to 20 s?
Step 1: Identify the shape of the graph in 10 - 20 s
The graph from \(t = 10\) to \(t = 20\space s\) is a horizontal line (constant velocity). The formula for the area of a rectangle (since velocity is constant) is \(A=v\times\Delta t\), where \(v\) is the constant velocity and \(\Delta t=20 - 10 = 10\space s\).
If \(v = 20\space m/s\) (from the graph), then \(A=20\times10=200\space m\)
Question 3: What was the displacement of the truck in the interval 25 to 30 s?
Step 1: Identify the shape of the graph in 25 - 30 s
The graph from \(t = 20\) to \(t = 30\space s\) is a line with positive slope. Let's find the velocity at \(t = 20\space s\) (which is \(20\space m/s\)) and at \(t = 30\space s\) (which is \(60\space m/s\)). The time interval \(\Delta t=30 - 25 = 5\space s\). The area of a trapezoid (or a triangle - trapezoid combination) is \(A=\frac{(v_{20}+v_{30})}{2}\times\Delta t\). Here, \(v_{20} = 20\space m/s\), \(v_{30}=60\space m/s\), \(\Delta t = 5\space s\). So \(A=\frac{(20 + 60)}{2}\times5=\frac{80}{2}\times5=200\space m\) (wait, no, the time interval is 25 - 30 s, so \(\Delta t=5\space s\), and at \(t = 25\space s\), \(v = 20\space m/s\), at \(t = 30\space s\), \(v = 60\space m/s\). So the area is \(\frac{(20 + 60)}{2}\times5 = 200\space m\))
Question 4: What was the distance of the entire trip?
Step 1: Calculate the area above the time - axis
- Interval 0 - 10 s: Trapezoid with \(v_0 = 5\space m/s\), \(v_{10}=20\space m/s\), \(\Delta t = 10\space s\). Area \(A_1=\frac{(5 + 20)}{2}\times10=\frac{25}{2}\times10 = 125\space m\)
- Interval 10 - 20 s: Rectangle with \(v = 20\space m/s\), \(\Delta t = 10\space s\). Area \(A_2=20\times10 = 200\space m\)
- Interval 20 - 30 s: Trapezoid with \(v_{20}=20\space m/s\), \(v_{30}=60\space m/s\), \(\Delta t = 10\space s\). Area \(A_3=\frac{(20 + 60)}{2}\times10=\frac{80}{2}\times10 = 400\space m\)
- Interval 30 - 40 s: Triangle with \(v_{30}=60\space m/s\), \(v_{40}=0\space m/s\), \(\Delta t = 10\space s\). Area \(A_4=\frac{1}{2}\times60\times10=300\space m\)
- Interval 40 - 50 s: Trapezoid (or triangle - like) with \(v_{40}=0\space m/s\), \(v_{50}=- 20\space m/s\) (assuming negative velocity for South direction), \(\Delta t = 10\space s\). The area (distance) is \(\frac{(0+\vert - 20\vert)}{2}\times10=\frac{20}{2}\times10 = 100\space m\)
Step 2: Sum up all the areas
Total distance \(D=A_1+A_2+A_3+A_4+A_5=125 + 200+400 + 300+100=1125\space m\) (the values are approximate based on assumed velocity scales. The actual values depend on the exact scale of the graph)
Question 5: What was the average speed for the whole trip?
Step 1: Recall the formula for average speed
Average speed \(=\frac{\text{Total Distance}}{\text{Total Time}}\)
Step 2: Calculate total distance and total time
Total time \(T = 50\space s\) (from \(t = 0\) to \(t = 50\space s\)). From question 4, total distance \(D = 1125\space m\) (approximate). So average speed \(=\frac{1125}{50}=22.5\space m/s\) (approximate)
Question 6: What was the displacement for the whole trip?
Step 1: Calculate the area above the time - axis (positive displacement) and below the time - axis (negative displacement)
- Positive area (0 - 40 s): \(A_{+}=125 + 200+400 + 300 = 1025\space m\)
- Negative area (40 - 50 s): \(A_{-}=100\space m\) (but since it's below the axis, displacement is \(A_{+}-A_{-}\))
Step 2: Calculate total displacement
Displacement \(=\) Area above axis \(-\) Area below axis \(=1025-100 = 925\space m\) (approximate, depending on the graph's scale)
Question 7: What was the average velocity for the whole trip?
Step 1: Recall the formula for average velocity
Average velocity \(=\frac{\text{Total Displacement}}{\text{Total Time}}\)
Step 2: Calculate total displacement and total time
Total time \(T = 50\space s\), total displacement \(d = 925\space m\) (from question 6). So average velocity \(=\frac{925}{50}=18.5\space m/s\) (approximate)
Question 8: In which interval was the acceleration the greatest?
Step 1: Recall that acceleration is the slope of the velocity - time graph
- Interval 0 - 10 s: Slope \(m_1=\frac{20 - 5}{10 - 0}=\frac{15}{10}=1.5\space m/s^2\)
- Interval 10 - 20 s: Slope \(m_2 = 0\space m/s^2\) (constant velocity)
- Interval 20 - 30 s: Slope \(m_3=\frac{60 - 20}{30 - 20}=\frac{40}{10}=4\space m/s^2\)
- Interval 30 - 40 s: Slope \(m_4=\frac{0 - 60}{40 - 30}=\frac{- 60}{10}=- 6\space m/s^2\) (magnitude 6)
- Interval 40 - 50 s: Slope \(m_5=\frac{-20 - 0}{50 - 40}=\frac{-20}{10}=- 2\space m/s^2\) (magnitude 2)
The greatest magnitude of acceleration is in the interval \(30 - 40\space s\) (slope magnitude 6)
Question 9: During which time intervals is the truck
a) Speeding up?
Speeding up occurs when velocity and acceleration have the same sign.
- Interval 0 - 10 s: Velocity is positive (North), acceleration is positive (slope positive). So speeding up.
- Interval 20 - 30 s: Velocity is positive (North), acceleration is positive (slope positive). So speeding up.
- Interval 40 - 50 s: Velocity is negative (South), acceleration is negative (slope negative). So speeding up.
b) Slowing down?
Slowing down occurs when velocity and acceleration have opposite signs.
- Interval 30 - 40 s: Velocity is positive (North), acceleration is negative (slope negative). So slowing down.
c) travelling South?
Travelling South means velocity is negative. From the graph, velocity is negative in the interval \(40 - 50\space s\) (since velocity is below the time - axis, assuming North is positive).
d) traveling North?
Travelling North means velocity is positive. From the graph, velocity is positive in the interval \(0 - 40\space s\) (since velocity is above the time - axis, assuming North is positive).
These are approximate answers based on assumed velocity scales from the graph. The exact answers would depend on the precise scale of the velocity - time graph (e.g., the value of each grid square on the y - axis).