QUESTION IMAGE
Question
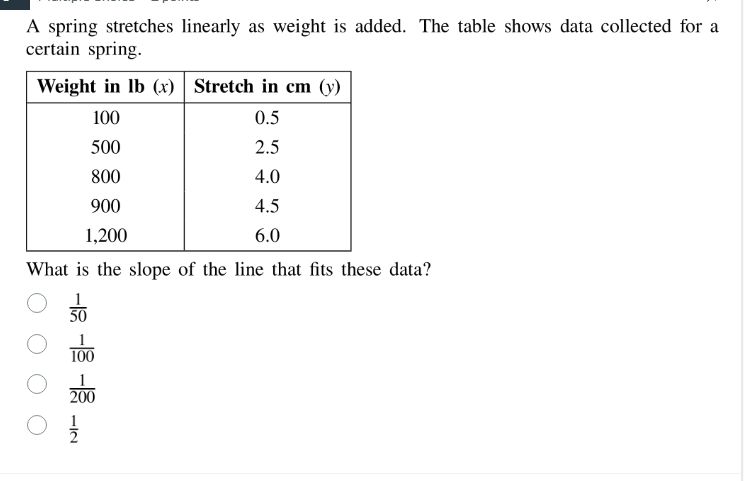
a spring stretches linearly as weight is added. the table shows data collected for a certain spring.
| weight in lb (x) | stretch in cm (y) |
|---|---|
| 500 | 2.5 |
| 800 | 4.0 |
| 900 | 4.5 |
| 1,200 | 6.0 |
what is the slope of the line that fits these data?
- $\frac{1}{50}$
- $\frac{1}{100}$
- $\frac{1}{200}$
- $\frac{1}{2}$
Step1: Recall slope formula
Slope $m = \frac{y_2 - y_1}{x_2 - x_1}$
Step2: Pick two data points
Use $(x_1,y_1)=(100, 0.5)$ and $(x_2,y_2)=(500, 2.5)$
Step3: Calculate slope
$m = \frac{2.5 - 0.5}{500 - 100} = \frac{2}{400} = \frac{1}{200}$
Step4: Verify with other points
Use $(800,4.0)$ and $(1200,6.0)$: $m = \frac{6.0 - 4.0}{1200 - 800} = \frac{2}{400} = \frac{1}{200}$

Snap & solve any problem in the app
Get step-by-step solutions on Sovi AI
Photo-based solutions with guided steps
Explore more problems and detailed explanations
$\frac{1}{200}$