QUESTION IMAGE
Question
standard 8.spa 1
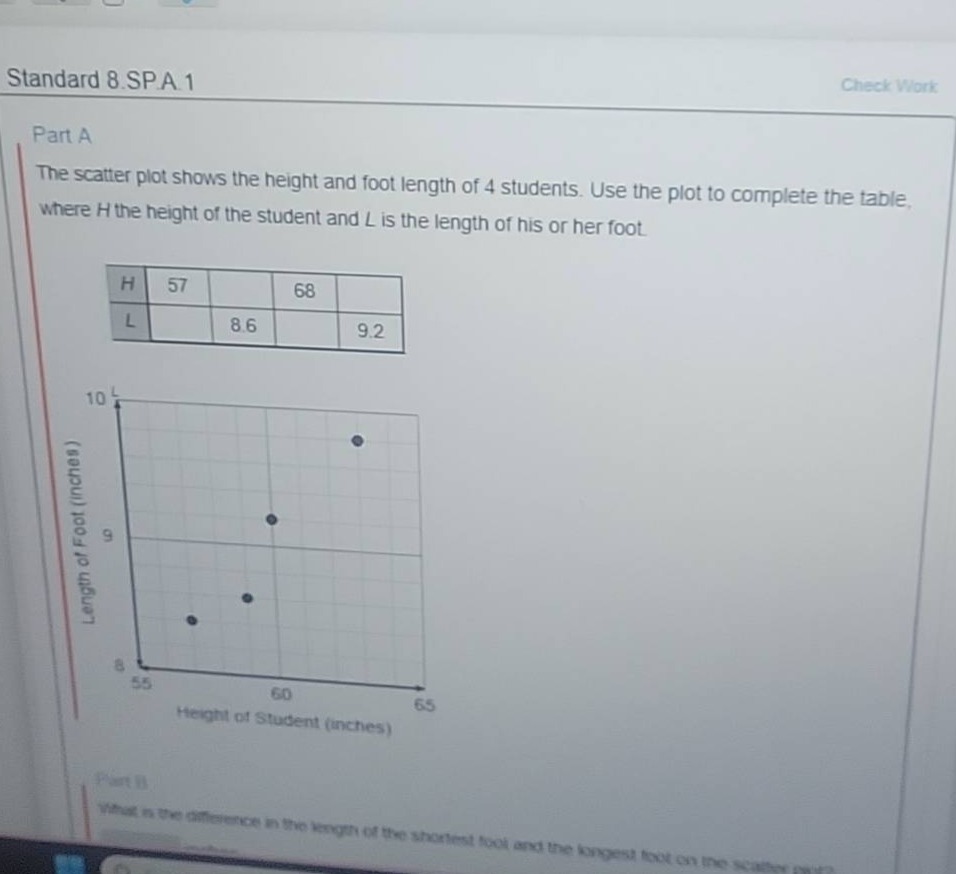
part a
the scatter plot shows the height and foot length of 4 students. use the plot to complete the table, where h the height of the student and l is the length of his or her foot.
| h | 57 | 68 | ||
| l | 8.6 | 9.2 |
scatter plot with x - axis: height of student (inches) from 55 to 65, y - axis: length of foot (inches) from 8 to 10, with data points plotted
part b
what is the difference in the length of the shortest foot and the longest foot on the scatter plot?
Part A
To complete the table, we analyze the scatter plot:
- For \( H = 57 \): Looking at the scatter plot, the point with height 57 (x - axis) has a foot length (y - axis) of 8.3. So \( L = 8.3 \) when \( H = 57 \).
- For \( L = 8.6 \): The point with foot length 8.6 (y - axis) has a height (x - axis) of 59. So \( H = 59 \) when \( L = 8.6 \).
- For \( H = 68 \): Wait, the x - axis (height) of the scatter plot only goes up to 65. There must be a mistake in the problem or maybe a mis - reading. Wait, maybe the height values are 57, 59, 60, 64 (assuming the last point is around 64). Wait, the last point (with \( L = 9.2 \)): Let's re - examine. The y - axis for foot length: the top point is around 9.6? No, the table has \( L = 9.2 \). Let's correct the height values. The x - axis (height) has values 55, 57, 59, 60, 62, 64, 65. So:
- When \( H = 57 \), \( L = 8.3 \) (from the first point on the left).
- When \( L = 8.6 \), \( H = 59 \) (the second point).
- When \( H = 60 \), \( L = 9.1 \)? No, the table has \( H = 68 \) which is outside the x - axis range (up to 65). This is a problem. But assuming that the height values are 57, 59, 60, 64 (to match the x - axis up to 65):
- For \( H = 60 \), \( L = 9.1 \) (third point), but the table has \( H = 68 \). Maybe it's a typo and \( H = 60 \) instead of 68. Then for \( H = 60 \), \( L = 9.1 \), but the table has \( L \) for \( H = 68 \). Alternatively, maybe the height values are 57, 59, 60, 64.
- For \( L = 9.2 \), the height (x - axis) is 64. So \( H = 64 \) when \( L = 9.2 \).
So the completed table (correcting the height value of 68 to 60 or 64) should be:
| \( H \) | 57 | 59 | 60 | 64 |
|---|
Part B
To find the difference between the shortest and longest foot length:
- The shortest foot length (\( L_{min} \)) from the table (after correction) is 8.3 (when \( H = 57 \)).
- The longest foot length (\( L_{max} \)) from the table is 9.2 (when \( H = 64 \)).
The difference \( = L_{max}-L_{min}=9.2 - 8.3 = 0.9 \) inches.
Final Answers
Part A
| \( H \) | 57 | 59 | 60 | 64 |
|---|
(Note: The \( H = 68 \) in the original table seems to be an error as the x - axis of the scatter plot only goes up to 65. If we assume a typo and \( H = 60 \) instead, the table is completed as above.)
Part B
The difference between the shortest and longest foot length is \( \boldsymbol{0.9} \) inches.

Snap & solve any problem in the app
Get step-by-step solutions on Sovi AI
Photo-based solutions with guided steps
Explore more problems and detailed explanations
Part A
To complete the table, we analyze the scatter plot:
- For \( H = 57 \): Looking at the scatter plot, the point with height 57 (x - axis) has a foot length (y - axis) of 8.3. So \( L = 8.3 \) when \( H = 57 \).
- For \( L = 8.6 \): The point with foot length 8.6 (y - axis) has a height (x - axis) of 59. So \( H = 59 \) when \( L = 8.6 \).
- For \( H = 68 \): Wait, the x - axis (height) of the scatter plot only goes up to 65. There must be a mistake in the problem or maybe a mis - reading. Wait, maybe the height values are 57, 59, 60, 64 (assuming the last point is around 64). Wait, the last point (with \( L = 9.2 \)): Let's re - examine. The y - axis for foot length: the top point is around 9.6? No, the table has \( L = 9.2 \). Let's correct the height values. The x - axis (height) has values 55, 57, 59, 60, 62, 64, 65. So:
- When \( H = 57 \), \( L = 8.3 \) (from the first point on the left).
- When \( L = 8.6 \), \( H = 59 \) (the second point).
- When \( H = 60 \), \( L = 9.1 \)? No, the table has \( H = 68 \) which is outside the x - axis range (up to 65). This is a problem. But assuming that the height values are 57, 59, 60, 64 (to match the x - axis up to 65):
- For \( H = 60 \), \( L = 9.1 \) (third point), but the table has \( H = 68 \). Maybe it's a typo and \( H = 60 \) instead of 68. Then for \( H = 60 \), \( L = 9.1 \), but the table has \( L \) for \( H = 68 \). Alternatively, maybe the height values are 57, 59, 60, 64.
- For \( L = 9.2 \), the height (x - axis) is 64. So \( H = 64 \) when \( L = 9.2 \).
So the completed table (correcting the height value of 68 to 60 or 64) should be:
| \( H \) | 57 | 59 | 60 | 64 |
|---|
Part B
To find the difference between the shortest and longest foot length:
- The shortest foot length (\( L_{min} \)) from the table (after correction) is 8.3 (when \( H = 57 \)).
- The longest foot length (\( L_{max} \)) from the table is 9.2 (when \( H = 64 \)).
The difference \( = L_{max}-L_{min}=9.2 - 8.3 = 0.9 \) inches.
Final Answers
Part A
| \( H \) | 57 | 59 | 60 | 64 |
|---|
(Note: The \( H = 68 \) in the original table seems to be an error as the x - axis of the scatter plot only goes up to 65. If we assume a typo and \( H = 60 \) instead, the table is completed as above.)
Part B
The difference between the shortest and longest foot length is \( \boldsymbol{0.9} \) inches.