QUESTION IMAGE
Question
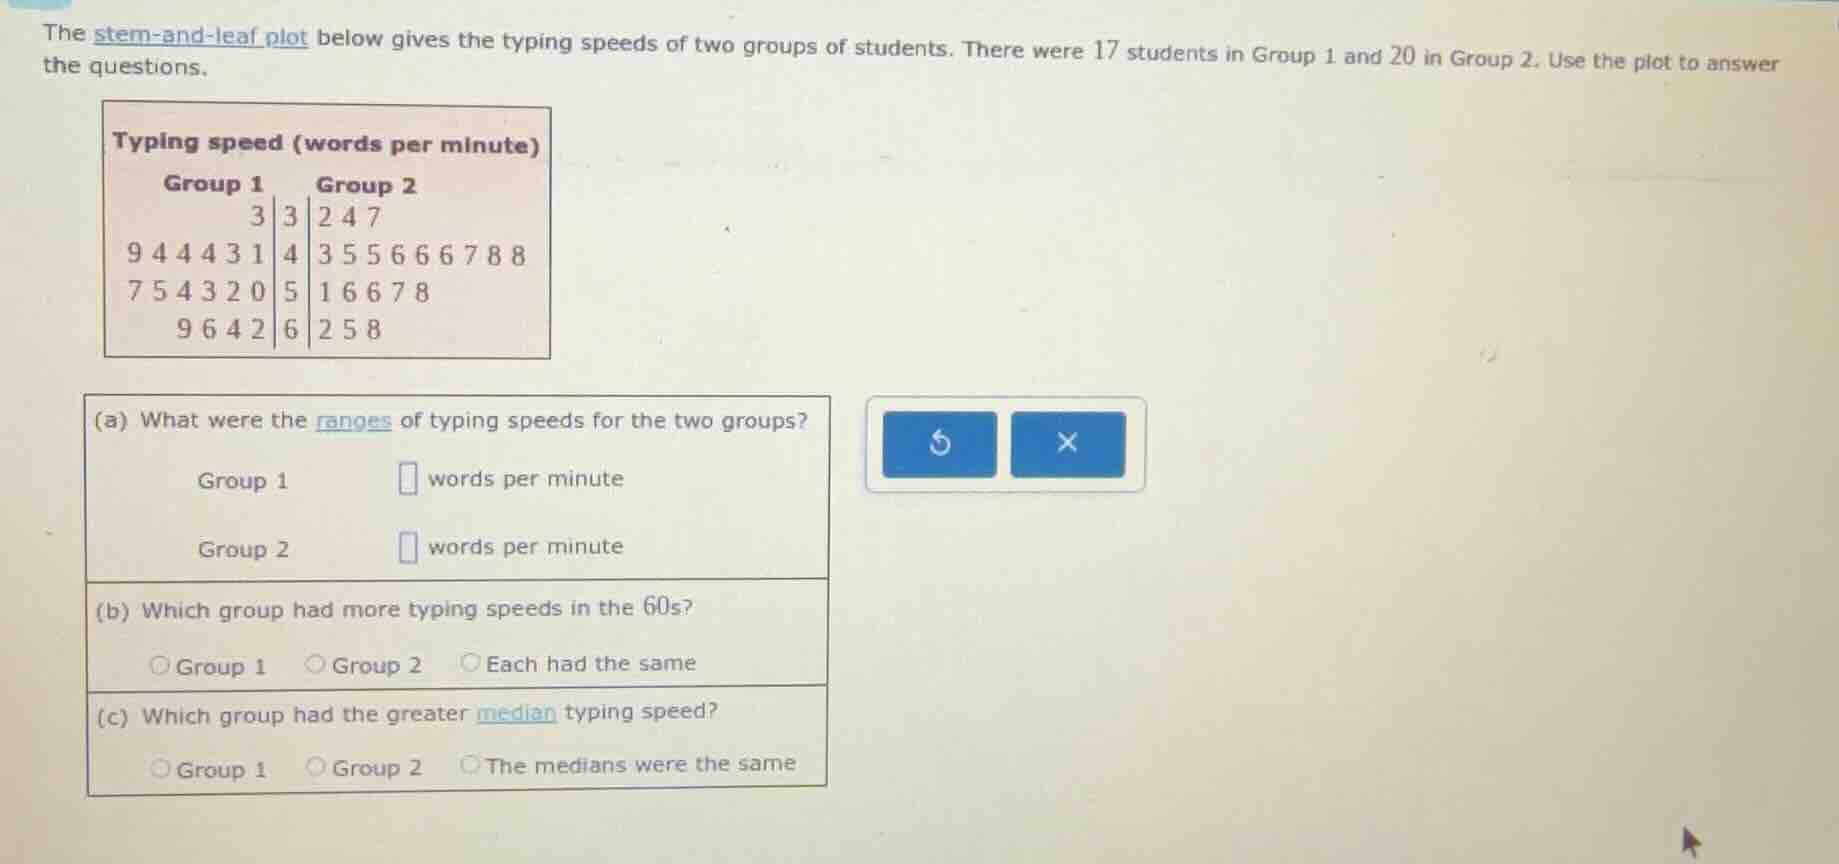
the stem-and-leaf plot below gives the typing speeds of two groups of students. there were 17 students in group 1 and 20 in group 2. use the plot to answer the questions.
typing speed (words per minute)
group 1 group 2
3 | 3 | 2 4 7
9 4 4 4 3 1 | 4 | 3 5 5 6 6 6 7 8 8
7 5 4 3 2 0 | 5 | 1 6 6 7 8
9 6 4 2 | 6 | 2 5 8
(a) what were the ranges of typing speeds for the two groups?
group 1 \boxed{} words per minute
group 2 \boxed{} words per minute
(b) which group had more typing speeds in the 60s?
\circ group 1 \circ group 2 \circ each had the same
(c) which group had the greater median typing speed?
\circ group 1 \circ group 2 \circ the medians were the same
Step1: Find Group 1 min/max speed
Min speed: 33, Max speed: 69
Step2: Calculate Group 1 range
$\text{Range}_1 = 69 - 33 = 36$
Step3: Find Group 2 min/max speed
Min speed: 32, Max speed: 68
Step4: Calculate Group 2 range
$\text{Range}_2 = 68 - 32 = 36$
Step5: Count 60s speeds per group
Group 1: 4 values (62,64,66,69); Group 2: 3 values (62,65,68)
Step6: Find Group 1 median
17 values, median = 9th value: 50
Step7: Find Group 2 median
20 values, median = $\frac{10\text{th} + 11\text{th}}{2} = \frac{46 + 46}{2} = 46$

Snap & solve any problem in the app
Get step-by-step solutions on Sovi AI
Photo-based solutions with guided steps
Explore more problems and detailed explanations
(a) Group 1: 36 words per minute
Group 2: 36 words per minute
(b) Group 1
(c) Group 1