QUESTION IMAGE
Question
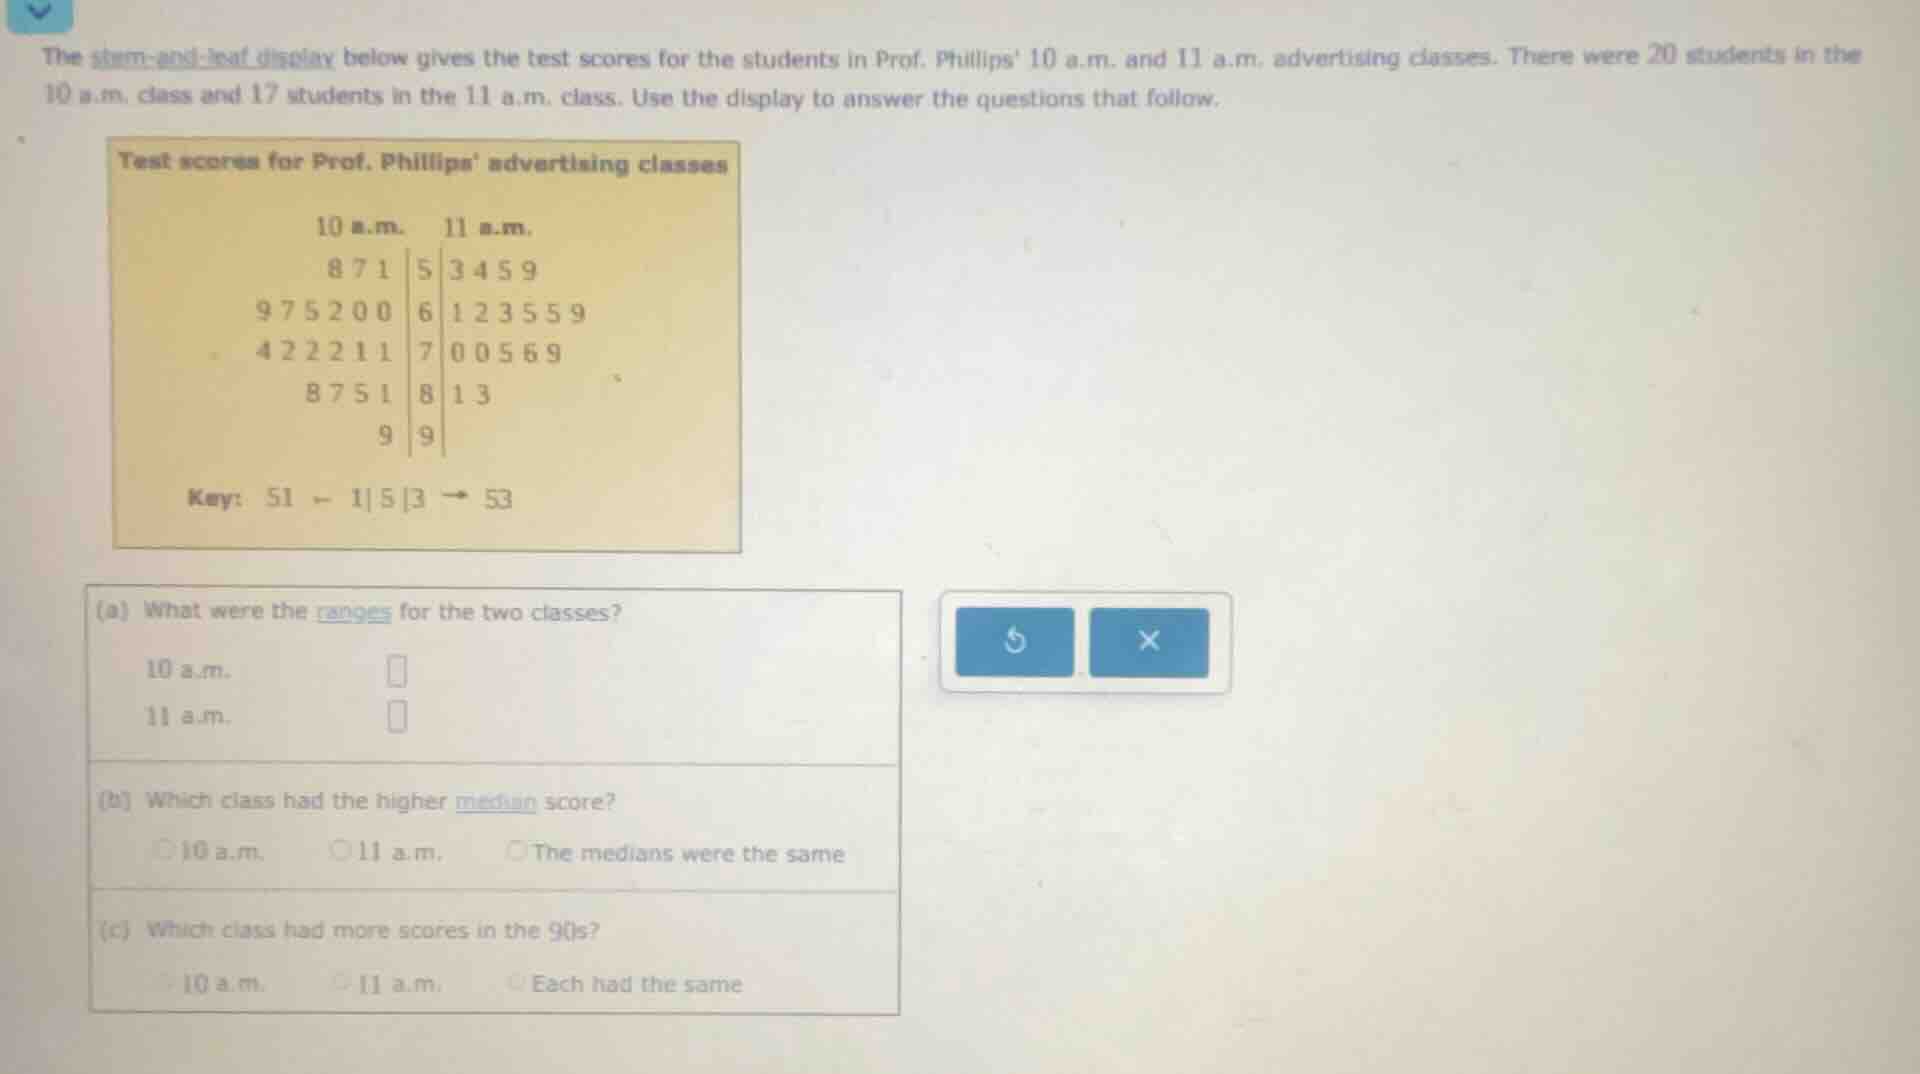
the stem - and - leaf display below gives the test scores for the students in prof. phillips 10 a.m. and 11 a.m. advertising classes. there were 20 students in the 10 a.m. class and 17 students in the 11 a.m. class. use the display to answer the questions that follow. test scores for prof. phillips advertising classes 10 a.m. 11 a.m. 8 7 1 | 5 3 4 5 9 9 7 5 2 0 0 | 6 1 2 3 5 5 9 4 2 2 2 1 1 | 7 0 0 5 6 9 8 7 5 1 | 8 1 3 9 | 9 key: 51 - 1|5|3 → 53 (a) what were the ranges for the two classes? 10 a.m. 11 a.m. (b) which class had the higher median score? 10 a.m. 11 a.m. the medians were the same (c) which class had more scores in the 90s? 10 a.m. 11 a.m. each had the same
Part (a)
To find the range, we use the formula \( \text{Range} = \text{Maximum value} - \text{Minimum value} \).
Step 1: For 10 a.m. class
- Minimum value: From the stem - and - leaf plot, the minimum score is \( 51 \) (stem \( 5 \), leaf \( 1 \)).
- Maximum value: The maximum score is \( 99 \) (stem \( 9 \), leaf \( 9 \)).
- Range for 10 a.m. class: \( 99 - 51=48 \)
Step 2: For 11 a.m. class
- Minimum value: The minimum score is \( 53 \) (stem \( 5 \), leaf \( 3 \)).
- Maximum value: The maximum score is \( 99 \) (stem \( 9 \), leaf \( 9 \)).
- Range for 11 a.m. class: \( 99 - 53 = 46 \)
Part (b)
The median is the middle value of a data set. If the number of data points \( n \) is even, the median is the average of the \( \frac{n}{2} \)-th and \( (\frac{n}{2}+ 1) \)-th values. If \( n \) is odd, the median is the \( \frac{n + 1}{2} \)-th value.
Step 1: For 10 a.m. class (\( n = 20 \), even)
- We need to find the 10th and 11th values when the data is ordered.
- Let's list the data points from the stem - and - leaf plot:
- Stem \( 5 \): \( 51,57,58 \)
- Stem \( 6 \): \( 60,60,62,65,67,69 \)
- Stem \( 7 \): \( 71,71,72,72,72,74 \)
- Stem \( 8 \): \( 81,85,87,88 \)
- Stem \( 9 \): \( 99 \)
- Ordering the data (already in order from the stem - and - leaf plot structure), the 10th value is \( 71 \) and the 11th value is \( 72 \).
- Median for 10 a.m. class: \( \frac{71 + 72}{2}=\frac{143}{2}=71.5 \)
Step 2: For 11 a.m. class (\( n = 17 \), odd)
- We need to find the \( \frac{17+1}{2}=9 \)-th value.
- List the data points from the stem - and - leaf plot:
- Stem \( 5 \): \( 53,54,55,59 \)
- Stem \( 6 \): \( 61,62,63,65,65,69 \)
- Stem \( 7 \): \( 70,70,75,76,79 \)
- Stem \( 8 \): \( 81,83 \)
- Stem \( 9 \): \( 99 \)
- Ordering the data, the 9th value is \( 69 \)
- Since \( 71.5>69 \), the 10 a.m. class has a higher median.
Part (c)
We check the number of scores in the 90s (stem \( 9 \)) for each class.
Step 1: For 10 a.m. class
- From the stem - and - leaf plot, in the 10 a.m. class, the number of scores in the 90s is \( 1 \) (score \( 99 \)).
Step 2: For 11 a.m. class
- From the stem - and - leaf plot, in the 11 a.m. class, the number of scores in the 90s is \( 1 \) (score \( 99 \)). So each class has the same number of scores in the 90s.

Snap & solve any problem in the app
Get step-by-step solutions on Sovi AI
Photo-based solutions with guided steps
Explore more problems and detailed explanations
s:
(a) 10 a.m.: \( \boldsymbol{48} \); 11 a.m.: \( \boldsymbol{46} \)
(b) 10 a.m.
(c) Each had the same