QUESTION IMAGE
Question
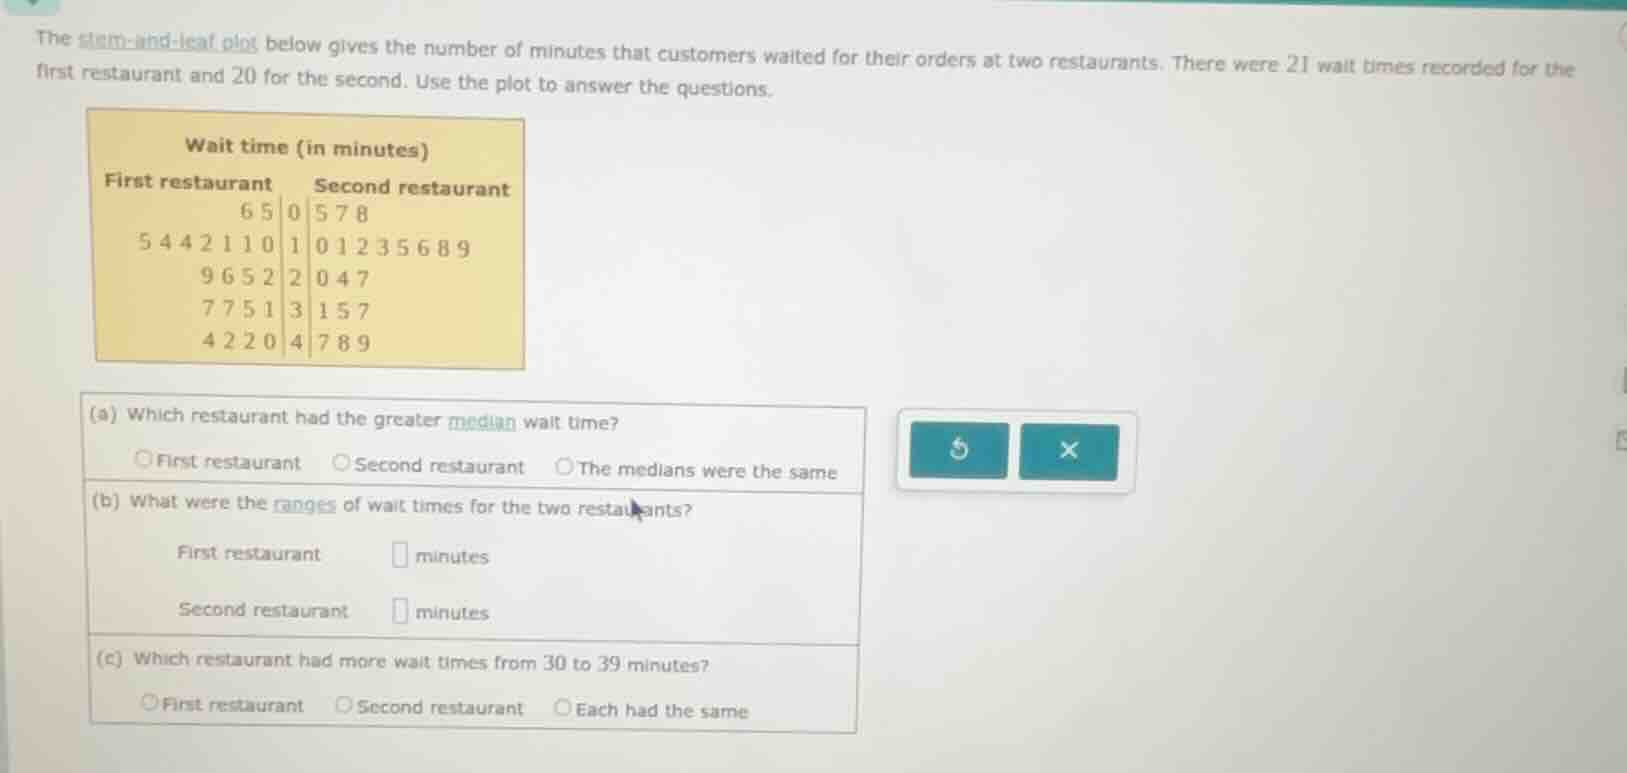
the stem - and - leaf plot below gives the number of minutes that customers waited for their orders at two restaurants. there were 21 wait times recorded for the first restaurant and 20 for the second. use the plot to answer the questions.
wait time (in minutes)
first restaurant second restaurant
6 5 | 0 | 5 7 8
5 4 4 2 1 1 0 | 1 | 0 1 2 3 5 6 8 9
9 6 5 2 | 2 | 0 4 7
7 7 5 1 | 3 | 1 5 7
4 2 2 0 | 4 | 7 8 9
(a) which restaurant had the greater median wait time?
first restaurant second restaurant the medians were the same
(b) what were the ranges of wait times for the two restaurants?
first restaurant minutes
second restaurant minutes
(c) which restaurant had more wait times from 30 to 39 minutes?
first restaurant second restaurant each had the same
Part (a)
Step1: Find median for First restaurant
The first restaurant has 21 data points. The median is the 11th value (since \( (21 + 1)/2 = 11 \)). Listing the data from the stem - leaf plot:
Stem 0: 5, 6
Stem 1: 0, 1, 1, 2, 4, 4, 5
Stem 2: 2, 5, 6, 9
Stem 3: 1, 5, 7, 7
Stem 4: 0, 2, 2, 4
Counting the values:
- 5 (0|5)
- 6 (0|6)
- 0 (1|0)
- 1 (1|1)
- 1 (1|1)
- 2 (1|2)
- 4 (1|4)
- 4 (1|4)
- 5 (1|5)
- 2 (2|2)
- 5 (2|5)
So the median for the first restaurant is 25.
Step2: Find median for Second restaurant
The second restaurant has 20 data points. The median is the average of the 10th and 11th values. Listing the data:
Stem 0: 5, 7, 8
Stem 1: 0, 1, 2, 3, 5, 6, 8, 9
Stem 2: 0, 4, 7
Stem 3: 1, 5, 7
Stem 4: 7, 8, 9
Counting the values:
- 5 (0|5)
- 7 (0|7)
- 8 (0|8)
- 0 (1|0)
- 1 (1|1)
- 2 (1|2)
- 3 (1|3)
- 5 (1|5)
- 6 (1|6)
- 8 (1|8)
- 9 (1|9)
- 0 (2|0)
- 4 (2|4)
- 7 (2|7)
- 1 (3|1)
- 5 (3|5)
- 7 (3|7)
- 7 (4|7)
- 8 (4|8)
- 9 (4|9)
The 10th value is 18 and the 11th value is 19. The median is \( \frac{18 + 19}{2}=18.5 \)
Since 25>18.5, the first restaurant has a greater median.
Step1: Find range for First restaurant
The range is the maximum value minus the minimum value. For the first restaurant, the minimum value is 5 (from stem 0, leaf 5) and the maximum value is 44 (from stem 4, leaf 4? Wait, stem 4 has leaves 0, 2, 2, 4. Wait, stem 4: 0, 2, 2, 4. Wait, the maximum value is 44? Wait, no. Wait, the stem - leaf plot: First restaurant stem 4 has leaves 0, 2, 2, 4. So the maximum value is 44? Wait, no, stem 4 represents 40 + leaf. So stem 4, leaf 4 is 44? Wait, no, stem 4: 0 is 40, 2 is 42, 2 is 42, 4 is 44. The minimum value is 5 (stem 0, leaf 5). So range = 44 - 5=39.
Wait, let's re - check. The first restaurant's data:
Stem 0: 5, 6 (values 5, 6)
Stem 1: 0, 1, 1, 2, 4, 4, 5 (values 10, 11, 11, 12, 14, 14, 15)
Stem 2: 2, 5, 6, 9 (values 22, 25, 26, 29)
Stem 3: 1, 5, 7, 7 (values 31, 35, 37, 37)
Stem 4: 0, 2, 2, 4 (values 40, 42, 42, 44)
Minimum value: 5, Maximum value: 44. Range = 44 - 5 = 39.
Step2: Find range for Second restaurant
For the second restaurant, the minimum value is 5 (stem 0, leaf 5) and the maximum value is 49 (stem 4, leaf 9). So range = 49 - 5 = 44.
Step1: Count wait times 30 - 39 for First restaurant
For the first restaurant, stem 3 has leaves 1, 5, 7, 7. So there are 4 values (31, 35, 37, 37) in the range 30 - 39.
Step2: Count wait times 30 - 39 for Second restaurant
For the second restaurant, stem 3 has leaves 1, 5, 7. So there are 3 values (31, 35, 37) in the range 30 - 39.
Since 4>3, the first restaurant has more wait times from 30 to 39 minutes.

Snap & solve any problem in the app
Get step-by-step solutions on Sovi AI
Photo-based solutions with guided steps
Explore more problems and detailed explanations
First restaurant