QUESTION IMAGE
Question
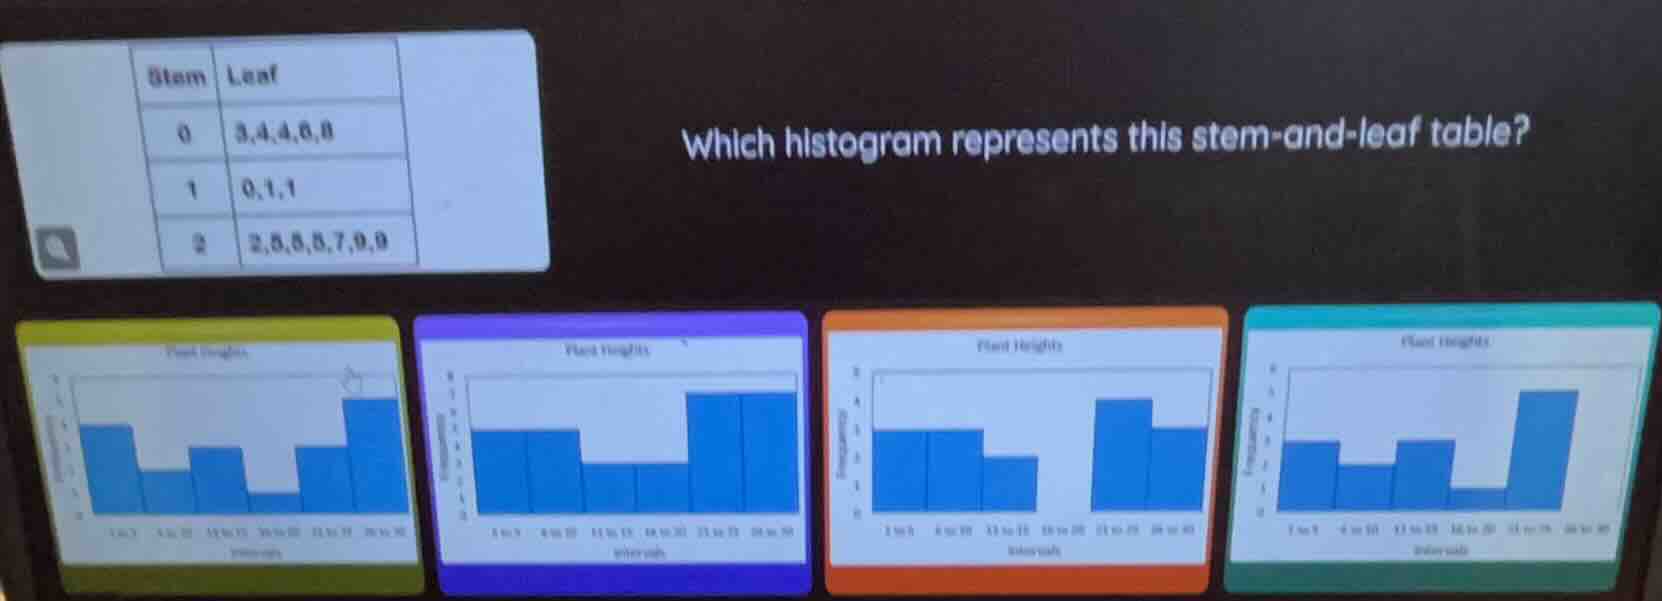
stem leaf
0 3,4,4,6,8
1 0,1,1
2 2,5,5,5,7,9,9
which histogram represents this stem-and-leaf table?
Step1: Count data per stem
Stem 0: 5 values (3,4,4,6,8)
Stem 1: 3 values (0,1,1)
Stem 2: 6 values (2,5,5,5,7,9,9)
Step2: Match to histogram intervals
Intervals correspond to 0-9 (stem 0), 10-19 (stem1), 20-29 (stem2). Frequencies: 5, 3, 6.
Step3: Identify matching histogram
Find histogram with heights 5, 3, 6 for the three intervals.

Snap & solve any problem in the app
Get step-by-step solutions on Sovi AI
Photo-based solutions with guided steps
Explore more problems and detailed explanations
The fourth (teal) histogram (with frequencies 4-5, 2-3, 5-6 matching 5, 3, 6 for intervals 1-9, 10-19, 20-29)