QUESTION IMAGE
Question
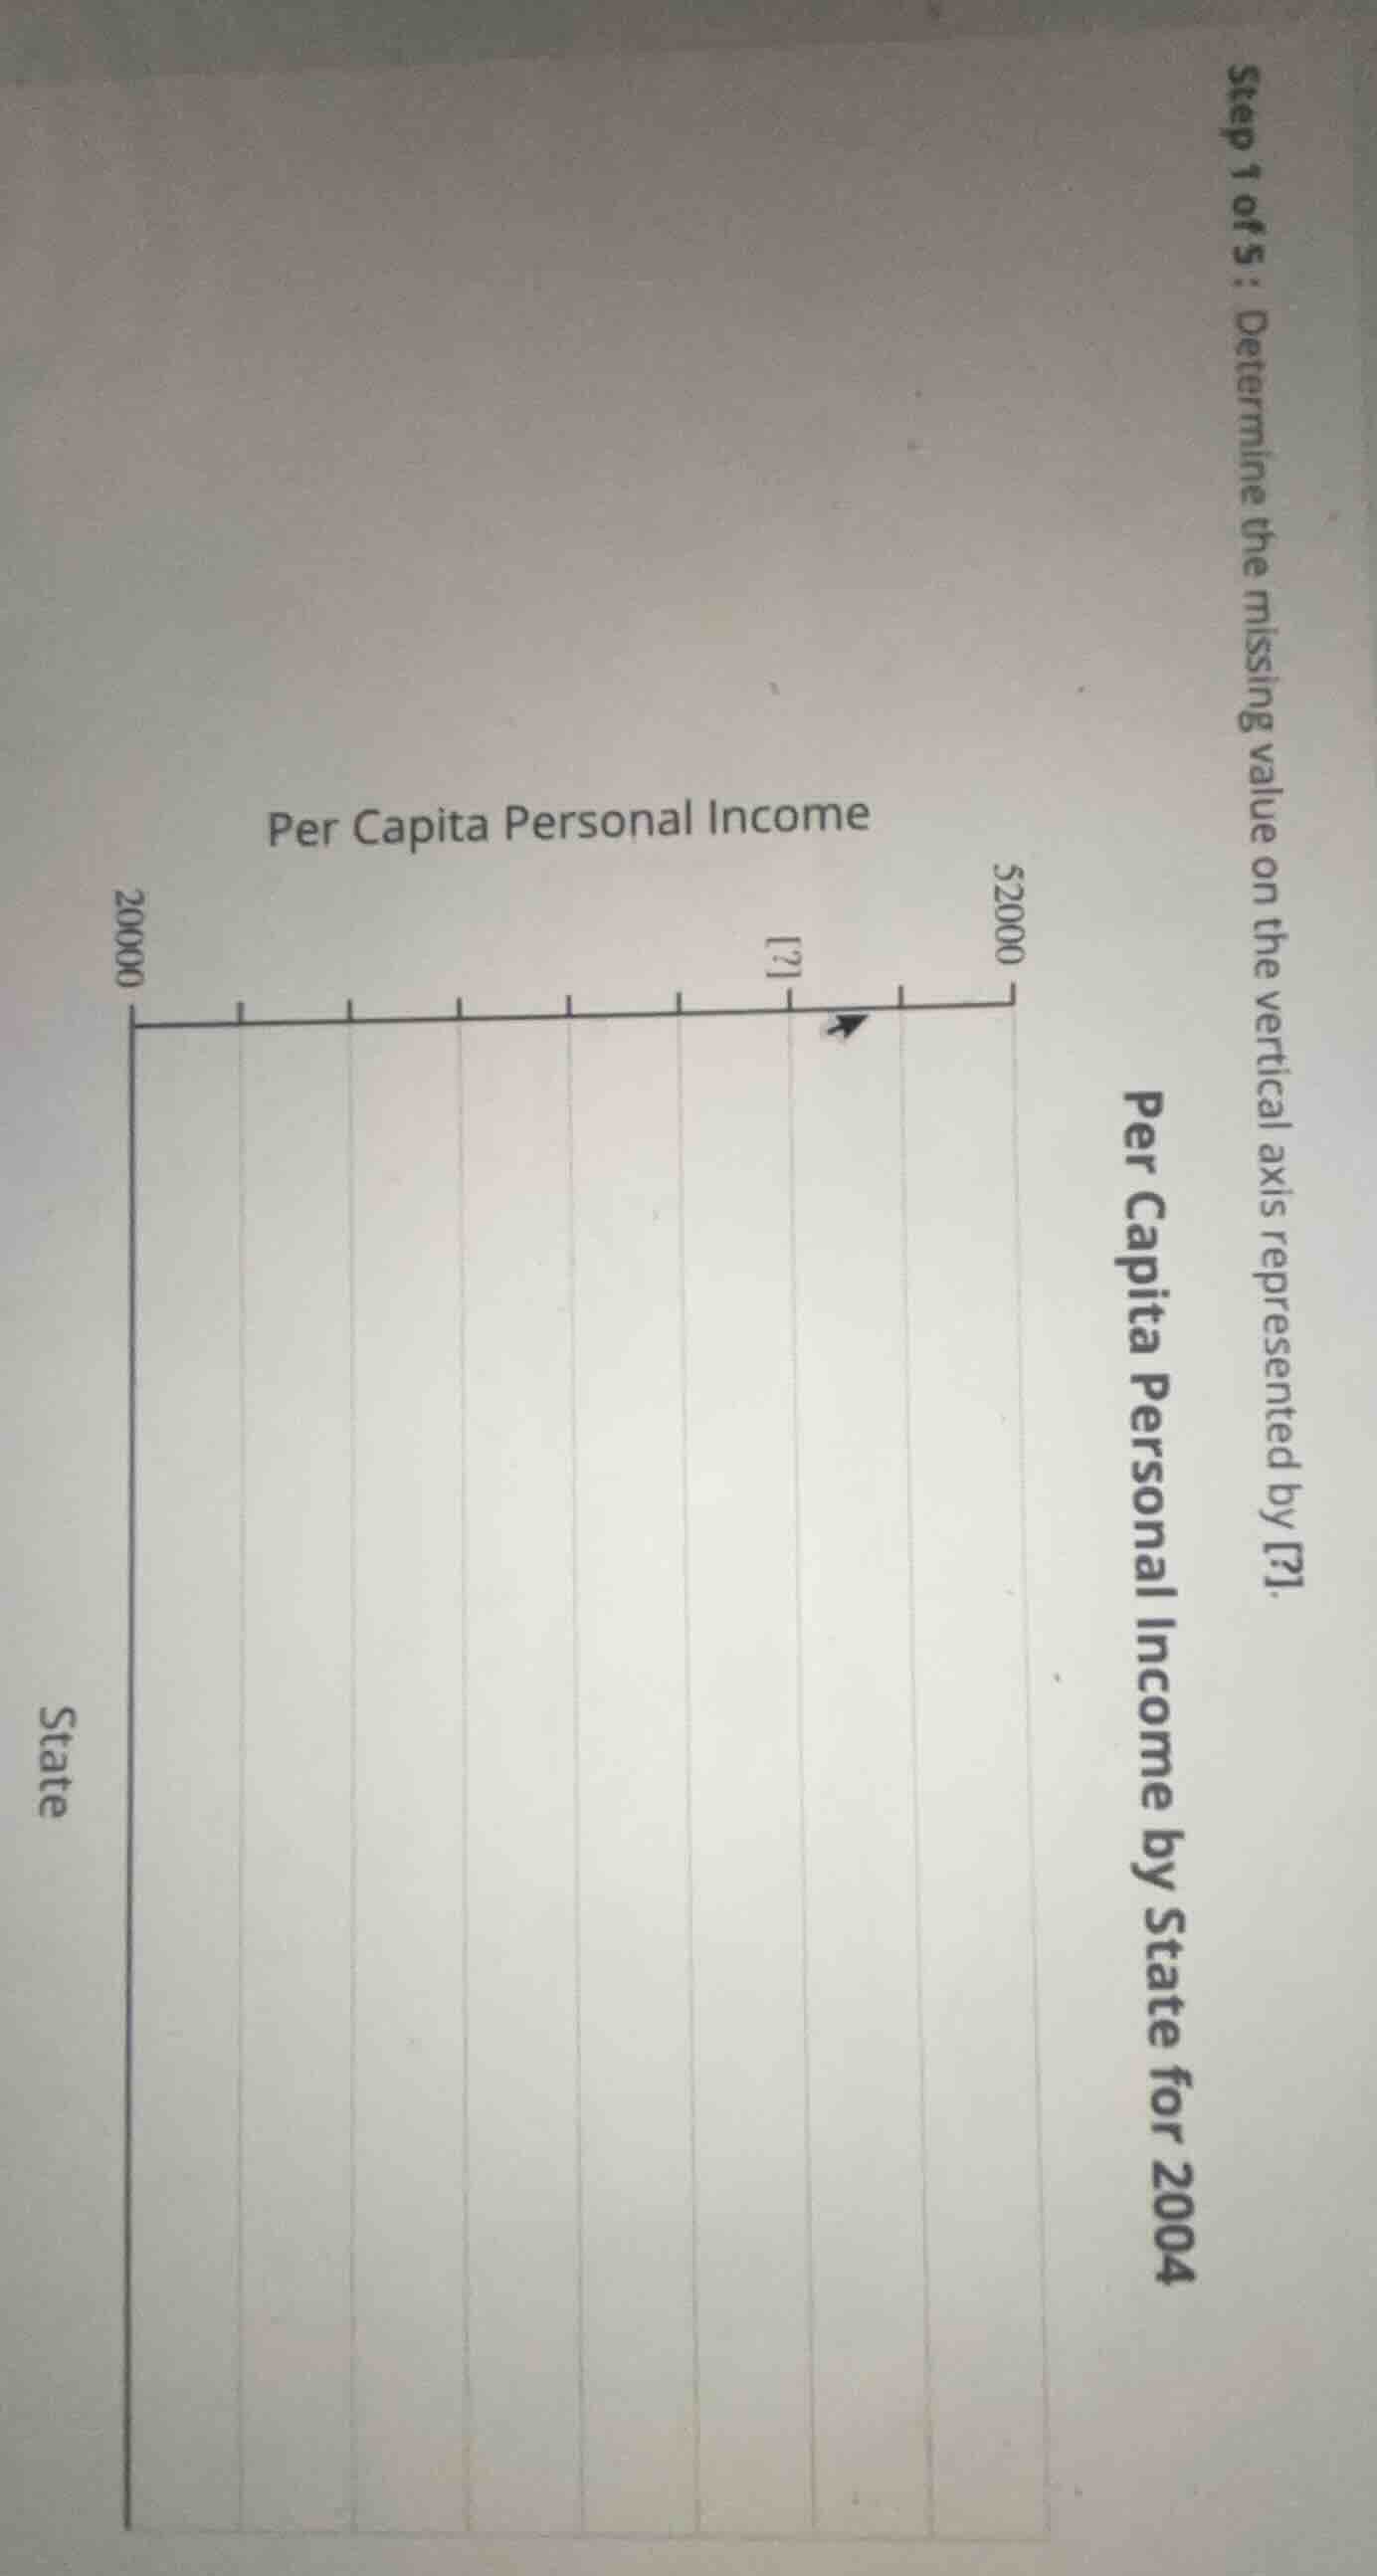
step 1 of 5: determine the missing value on the vertical axis represented by ?. per capita personal income by state for 2004 (chart: per capita personal income, vertical axis state, horizontal axis from 20000 to 52000 with ? marked)
Step1: Calculate interval between ticks
First, find the total range: $52000 - 20000 = 32000$.
Count the number of intervals: there are 8 equal spaces between 20000 and 52000.
Interval value: $\frac{32000}{8} = 4000$.
Step2: Count ticks from left to [?]
The [?] mark is the 7th tick from 20000 (starting at 0 for 20000).
Calculate the value: $20000 + (7 \times 4000)$
Step3: Compute final value
$20000 + 28000 = 48000$

Snap & solve any problem in the app
Get step-by-step solutions on Sovi AI
Photo-based solutions with guided steps
Explore more problems and detailed explanations
48000