QUESTION IMAGE
Question
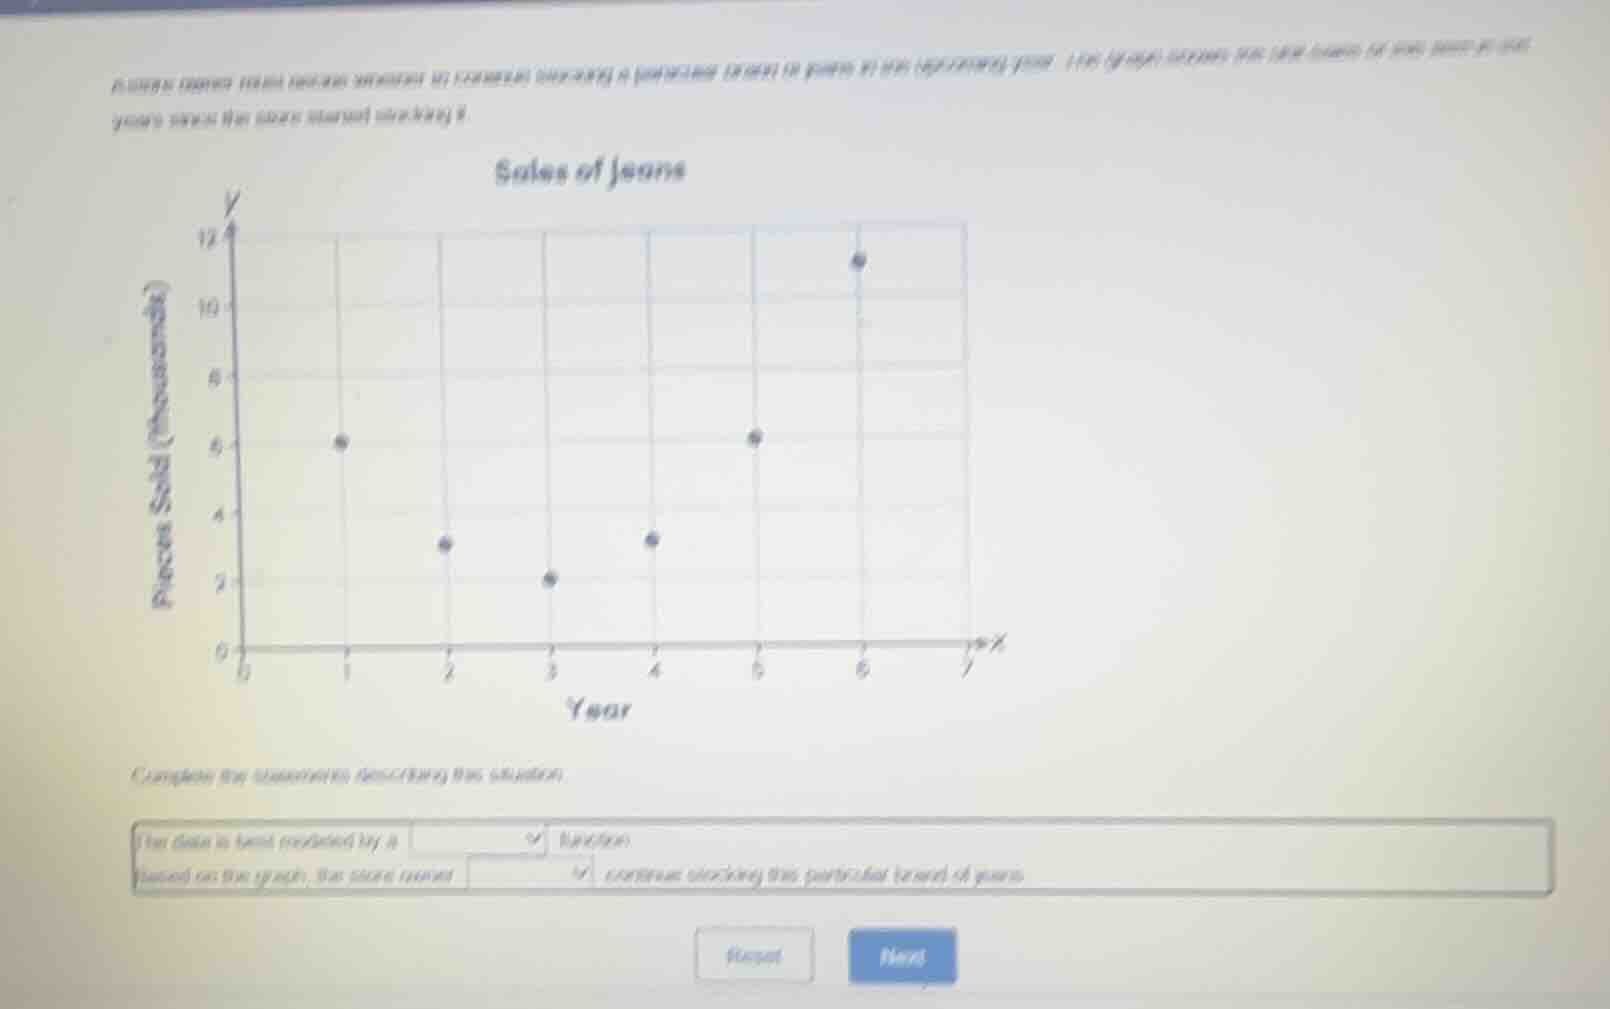
a store owner has been keeping a careful record of sales of one brand of jeans since the store started stocking it. the graph shows the total sales of this brand of jeans since the store started stocking it.
sales of jeans
complete the statements describing this situation.
the data is best modeled by a ______ function.
based on the graph, the store owner ______ continue stocking this particular brand of jeans.
Brief Explanations
- Looking at the scatter plot, the data points do not follow a consistent linear (straight line) trend; instead, they fluctuate and then show a sharp upward increase, which fits a non-linear pattern.
- In year 6, there is a large spike in sales (11 thousand pieces sold), which is the highest value in the dataset. This indicates strong demand, so the store should continue stocking this brand.

Snap & solve any problem in the app
Get step-by-step solutions on Sovi AI
Photo-based solutions with guided steps
Explore more problems and detailed explanations
The data is best modeled by a non-linear function
Based on the graph, the store should continue stocking this particular brand of jeans