QUESTION IMAGE
Question
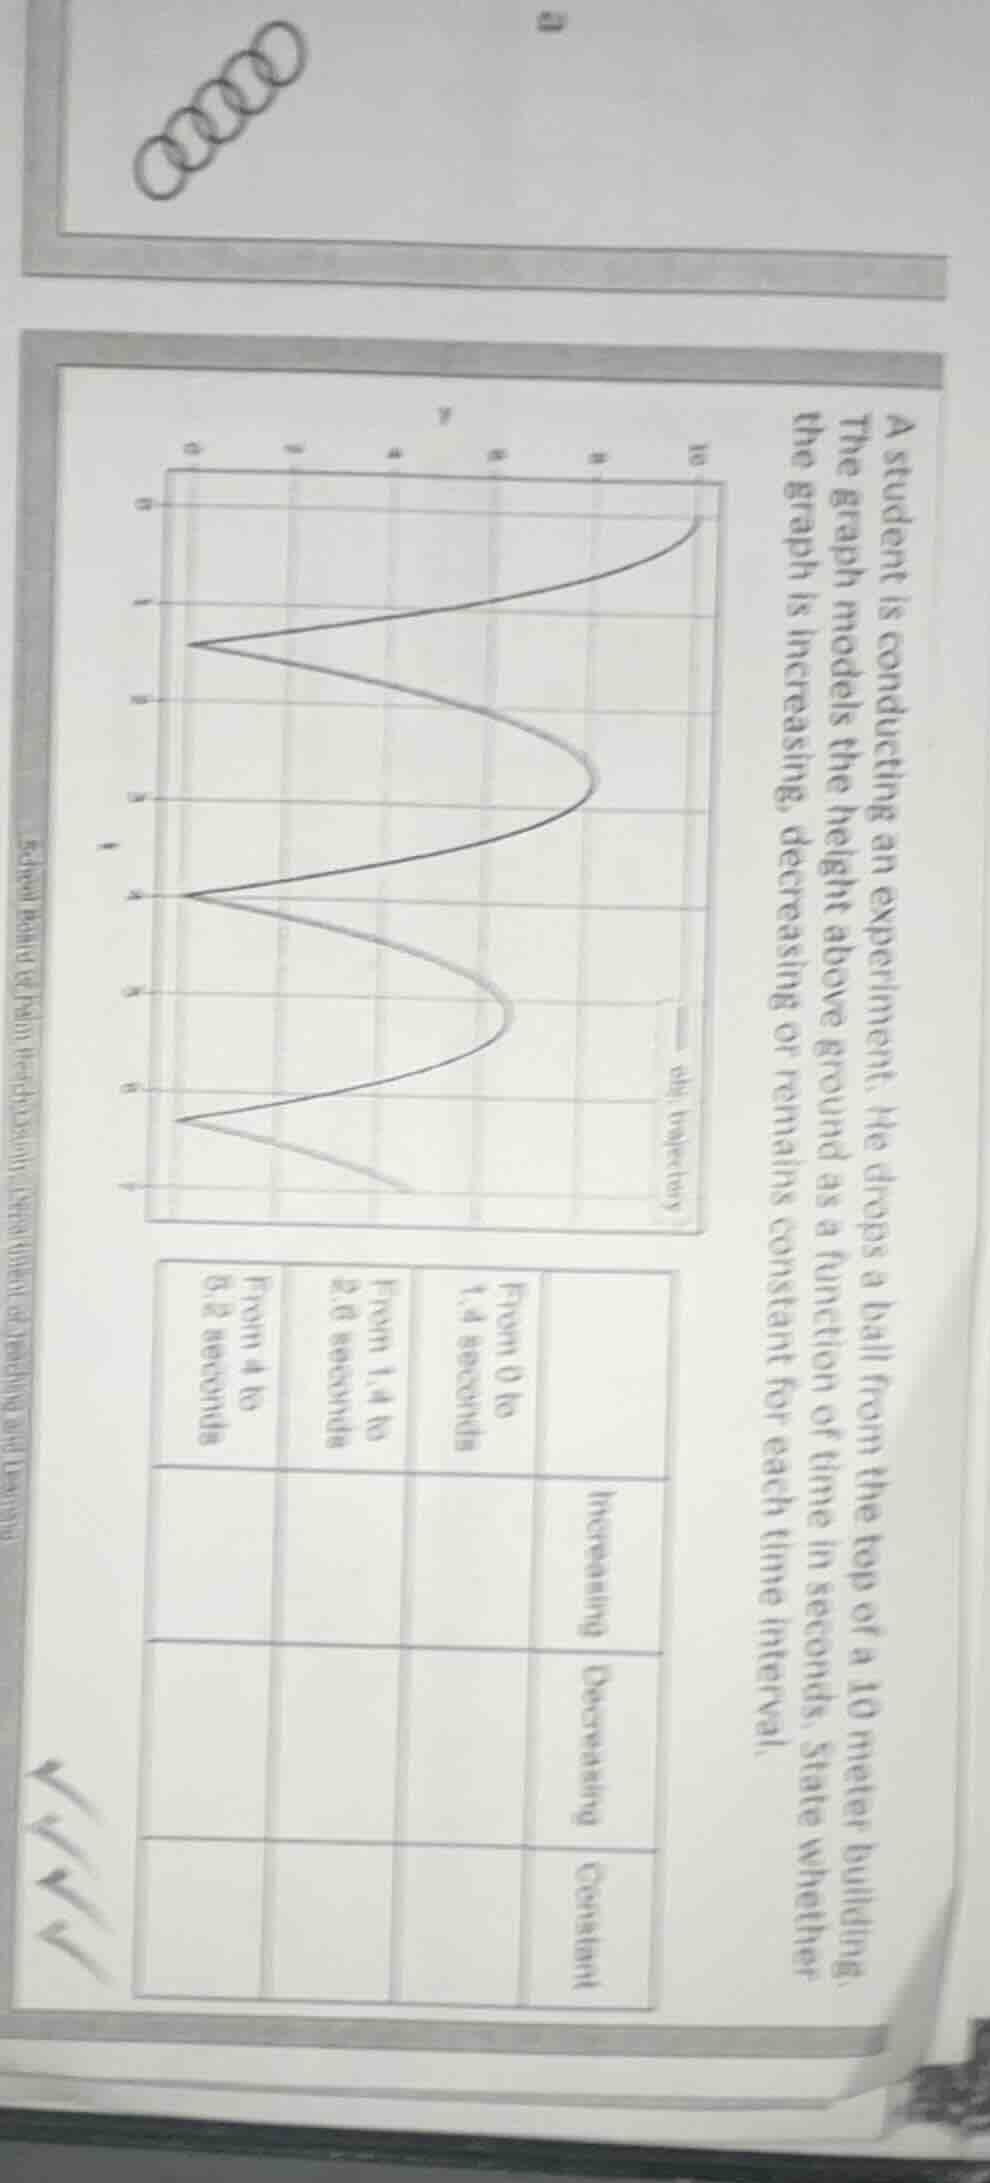
a student is conducting an experiment. he drops a ball from the top of a 10 meter building. the graph models the height above ground as a function of time in seconds. state whether the graph is increasing, decreasing or remains constant for each time interval. from 0 to 1.4 seconds from 1.4 to 2.6 seconds from 4 to 5.2 seconds
Step1: Analyze "From 0 to 1.4 seconds"
When the ball is dropped, initially (from 0 to 1.4 seconds), the height should be decreasing as the ball falls. Wait, no—wait, the graph: if it's a ball dropped from a building, the height above ground as a function of time. Wait, maybe the graph's y - axis is height, x - axis is time. So when time increases, if the graph is decreasing, height is decreasing. But let's check the intervals:
- From 0 to 1.4 seconds: Let's see the graph's trend. If the graph is increasing, height increases; decreasing, height decreases; constant, height same.
Wait, the problem is to state for each interval (0 - 1.4, 1.4 - 2.6, 4 - 5.2) whether the graph is increasing, decreasing, or constant.
Let's assume the graph:
- From 0 to 1.4 seconds: If the graph line is going up (increasing), but a ball dropped should fall, so maybe the graph is for multiple bounces? Wait, the graph has multiple curves, maybe multiple bounces. So first interval 0 - 1.4: maybe the first curve (when the ball is first dropped) – wait, maybe the y - axis is height, x - axis time. So when time starts at 0, height is 10m (top of building). Then as time increases to 1.4s, the height decreases (since the ball is falling), so the graph is decreasing? Wait, no, maybe the graph's first segment: let's re - read.
Wait, the table has three intervals:
- From 0 to 1.4 seconds:
- From 1.4 to 2.6 seconds:
- From 4 to 5.2 seconds:
Let's think about the motion of a ball dropped and bouncing:
- First, the ball is dropped: from t = 0 to t = 1.4s, it's falling, so height (y) decreases as time (x) increases → graph is decreasing.
- Then, from 1.4 to 2.6s, the ball bounces back up, so height increases as time increases → graph is increasing.
- From 4 to 5.2s, maybe the ball is falling again (after another bounce), so height decreases as time increases → graph is decreasing? Wait, no, maybe I got it wrong. Wait, the original problem's graph: let's assume the first interval (0 - 1.4s): the graph is decreasing (since height goes from 10m to lower as time goes from 0 to 1.4s). Second interval (1.4 - 2.6s): the ball bounces up, so height increases (graph increasing). Third interval (4 - 5.2s): maybe the ball is falling again, so height decreases (graph decreasing). But let's confirm:
Wait, the problem says "the graph models the height above ground as a function of time in seconds. State whether the graph is increasing, decreasing or remains constant for each time interval."
So:
- From 0 to 1.4 seconds: Decreasing (because the ball is falling from the building, height decreases as time increases).
- From 1.4 to 2.6 seconds: Increasing (because the ball bounces back up, height increases as time increases).
- From 4 to 5.2 seconds: Decreasing (because the ball is falling again after a bounce, height decreases as time increases).
But let's check the intervals:
- From 0 to 1.4 seconds: Decreasing
- From 1.4 to 2.6 seconds: Increasing
- From 4 to 5.2 seconds: Decreasing
Wait, maybe the graph's first part (0 - 1.4) is decreasing, 1.4 - 2.6 is increasing, 4 - 5.2 is decreasing. But let's make sure.
Alternatively, maybe the first interval (0 - 1.4s) is decreasing, second (1.4 - 2.6s) is increasing, third (4 - 5.2s) is decreasing.
But let's proceed step by step for each interval:
Step1: Interval 0 to 1.4 seconds
When the ball is released from the top of the 10 - meter building, it falls towards the ground. As time (x - value) increases from 0 to 1.4 seconds, the height above ground (y - value) decreases. So the graph is decreasing.
Step2: Inter…

Snap & solve any problem in the app
Get step-by-step solutions on Sovi AI
Photo-based solutions with guided steps
Explore more problems and detailed explanations
- From 0 to 1.4 seconds: Decreasing
- From 1.4 to 2.6 seconds: Increasing
- From 4 to 5.2 seconds: Decreasing