QUESTION IMAGE
Question
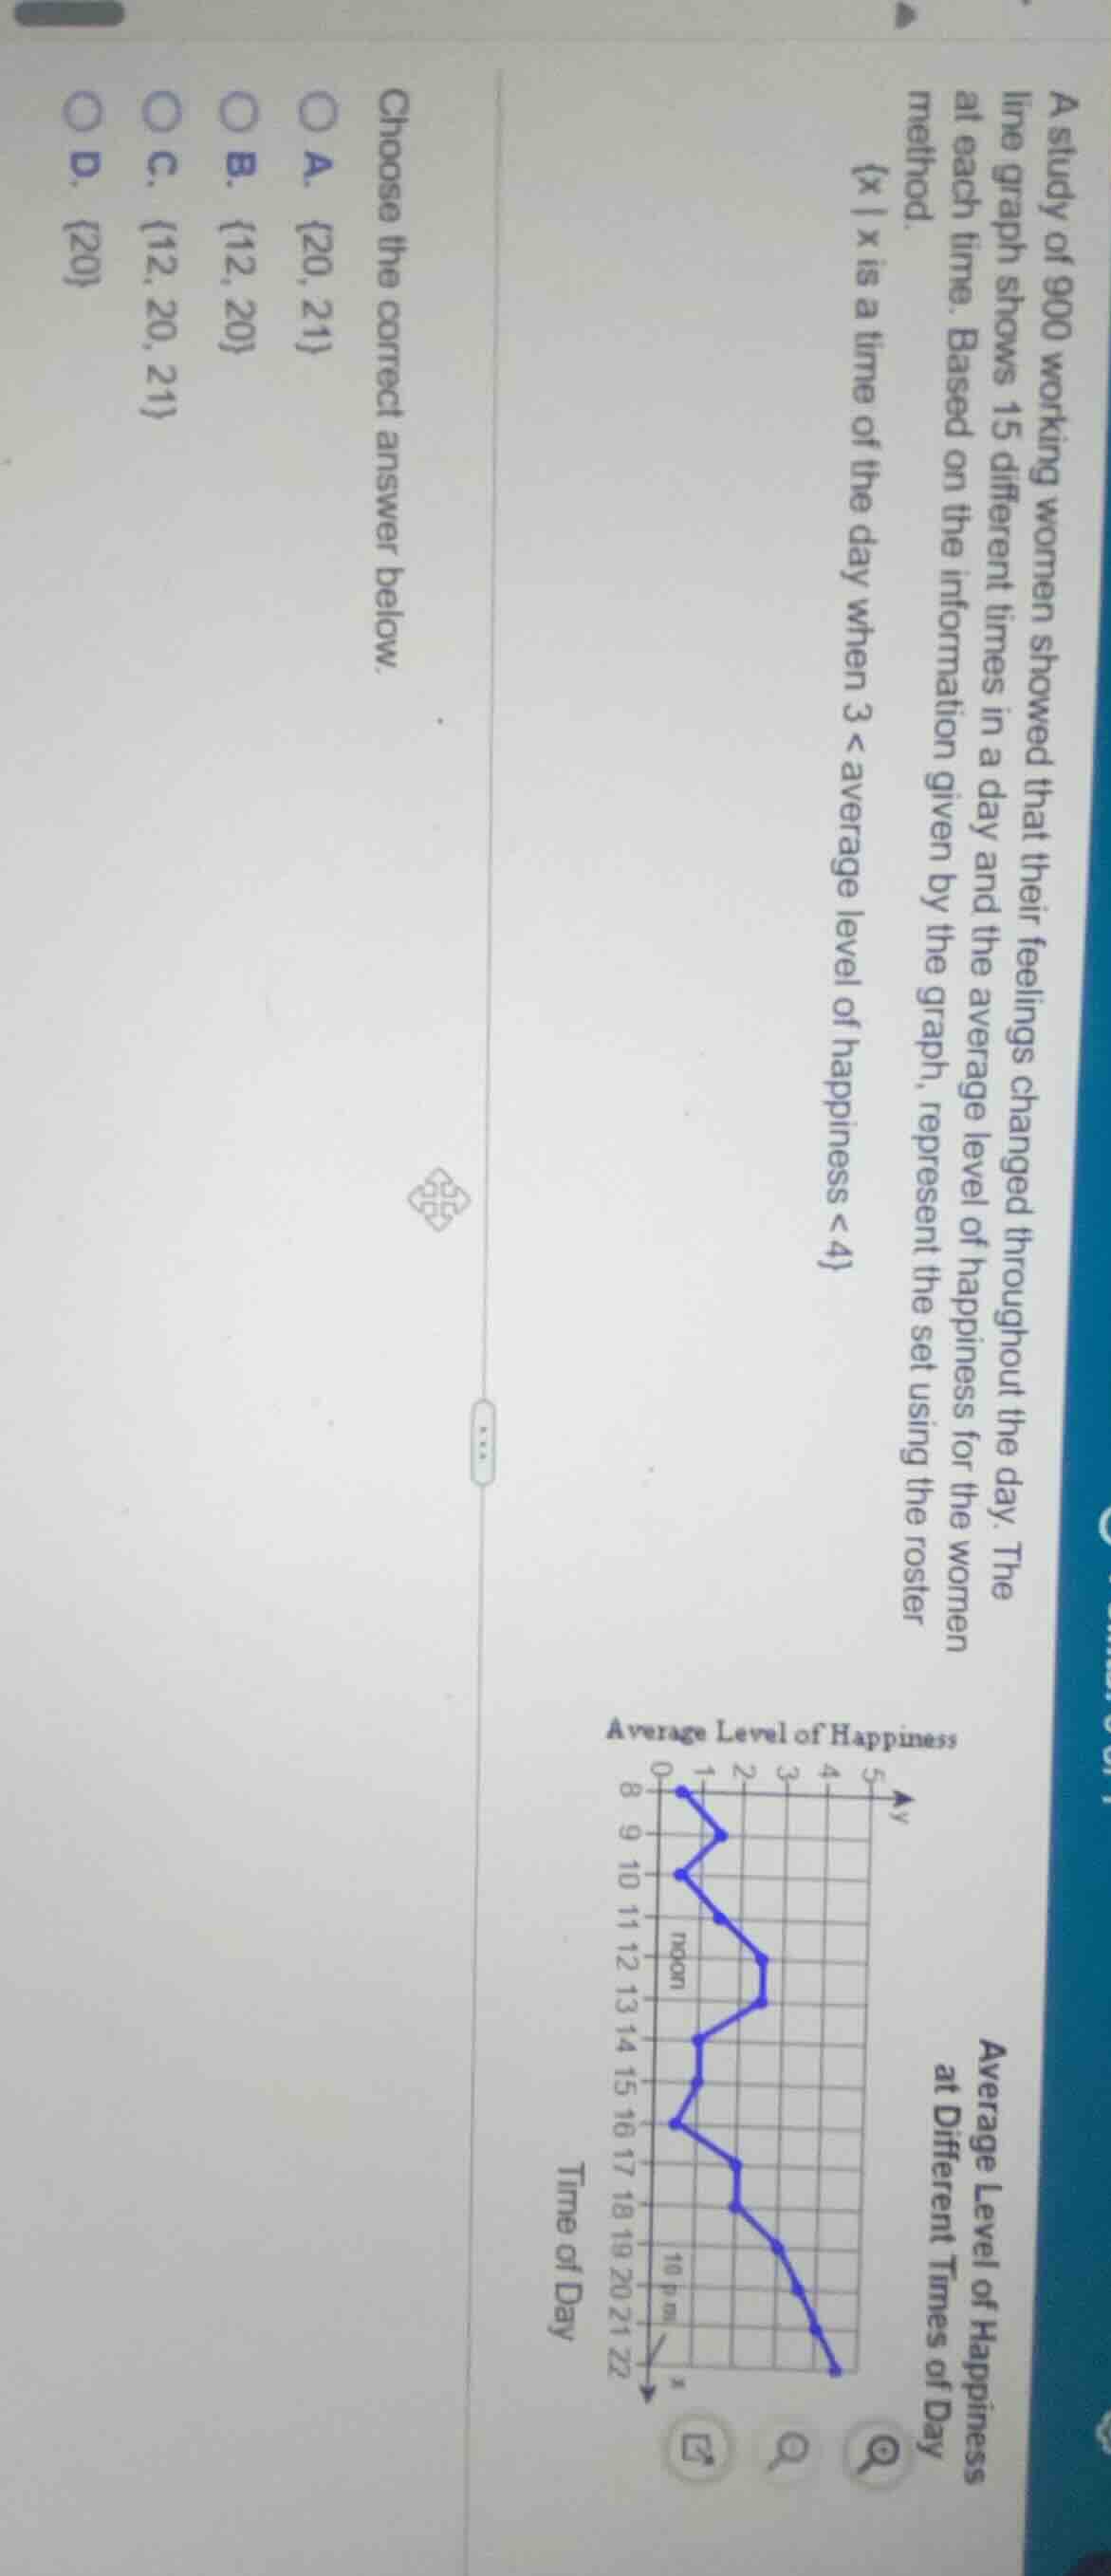
a study of 900 working women showed that their feelings changed throughout the day. the line graph shows 15 different times in a day and the average level of happiness for the women at each time. based on the information given by the graph, represent the set using the roster method. \\{x | x is a time of the day when 3 < average level of happiness < 4\\} choose the correct answer below. \\(\boldsymbol{\text{a. } \\{20, 21\\}}\\) \\(\boldsymbol{\text{b. } \\{12, 20\\}}\\) \\(\boldsymbol{\text{c. } \\{12, 20, 21\\}}\\) \\(\boldsymbol{\text{d. } \\{20\\}}\\)
Step1: Identify target happiness range
We need times where $3 < \text{happiness} < 4$.
Step2: Match times to range
Check the line graph:
- Time 12: Happiness is between 3 and 4
- Time 20: Happiness is between 3 and 4
- Time 21: Happiness is between 3 and 4
Step3: Compile roster set
Collect all qualifying times into a set.

Snap & solve any problem in the app
Get step-by-step solutions on Sovi AI
Photo-based solutions with guided steps
Explore more problems and detailed explanations
C. {12, 20, 21}