QUESTION IMAGE
Question
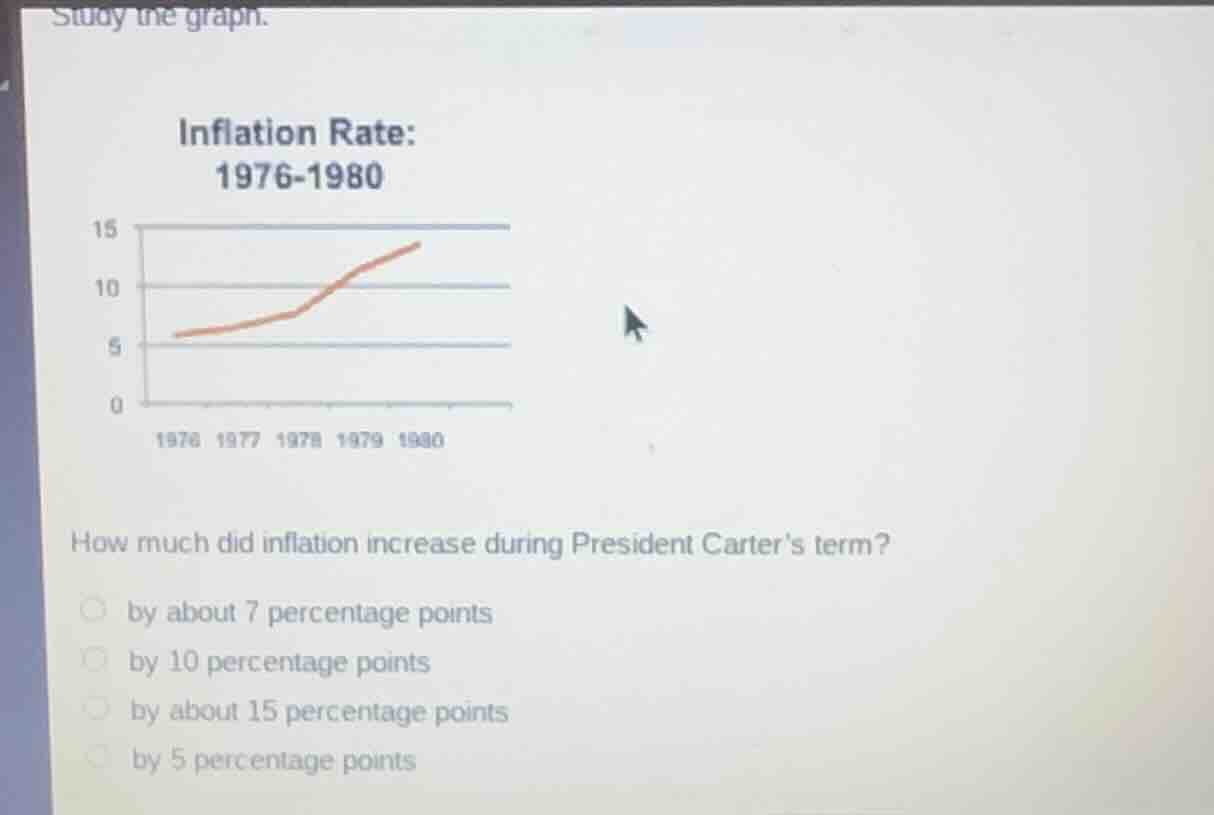
study the graph.
inflation rate:
1976-1980
(graph with y-axis 0-15, x-axis 1976-1980, red line showing inflation trend)
how much did inflation increase during president carter’s term?
- by about 7 percentage points
- by 10 percentage points
- by about 15 percentage points
- by 5 percentage points
Step1: Identify 1976 inflation value
From the graph, 1976 inflation ≈ 6%
Step2: Identify 1980 inflation value
From the graph, 1980 inflation ≈ 13%
Step3: Calculate the difference
$\text{Increase} = 13\% - 6\% = 7\%$

Snap & solve any problem in the app
Get step-by-step solutions on Sovi AI
Photo-based solutions with guided steps
Explore more problems and detailed explanations
by about 7 percentage points