QUESTION IMAGE
Question
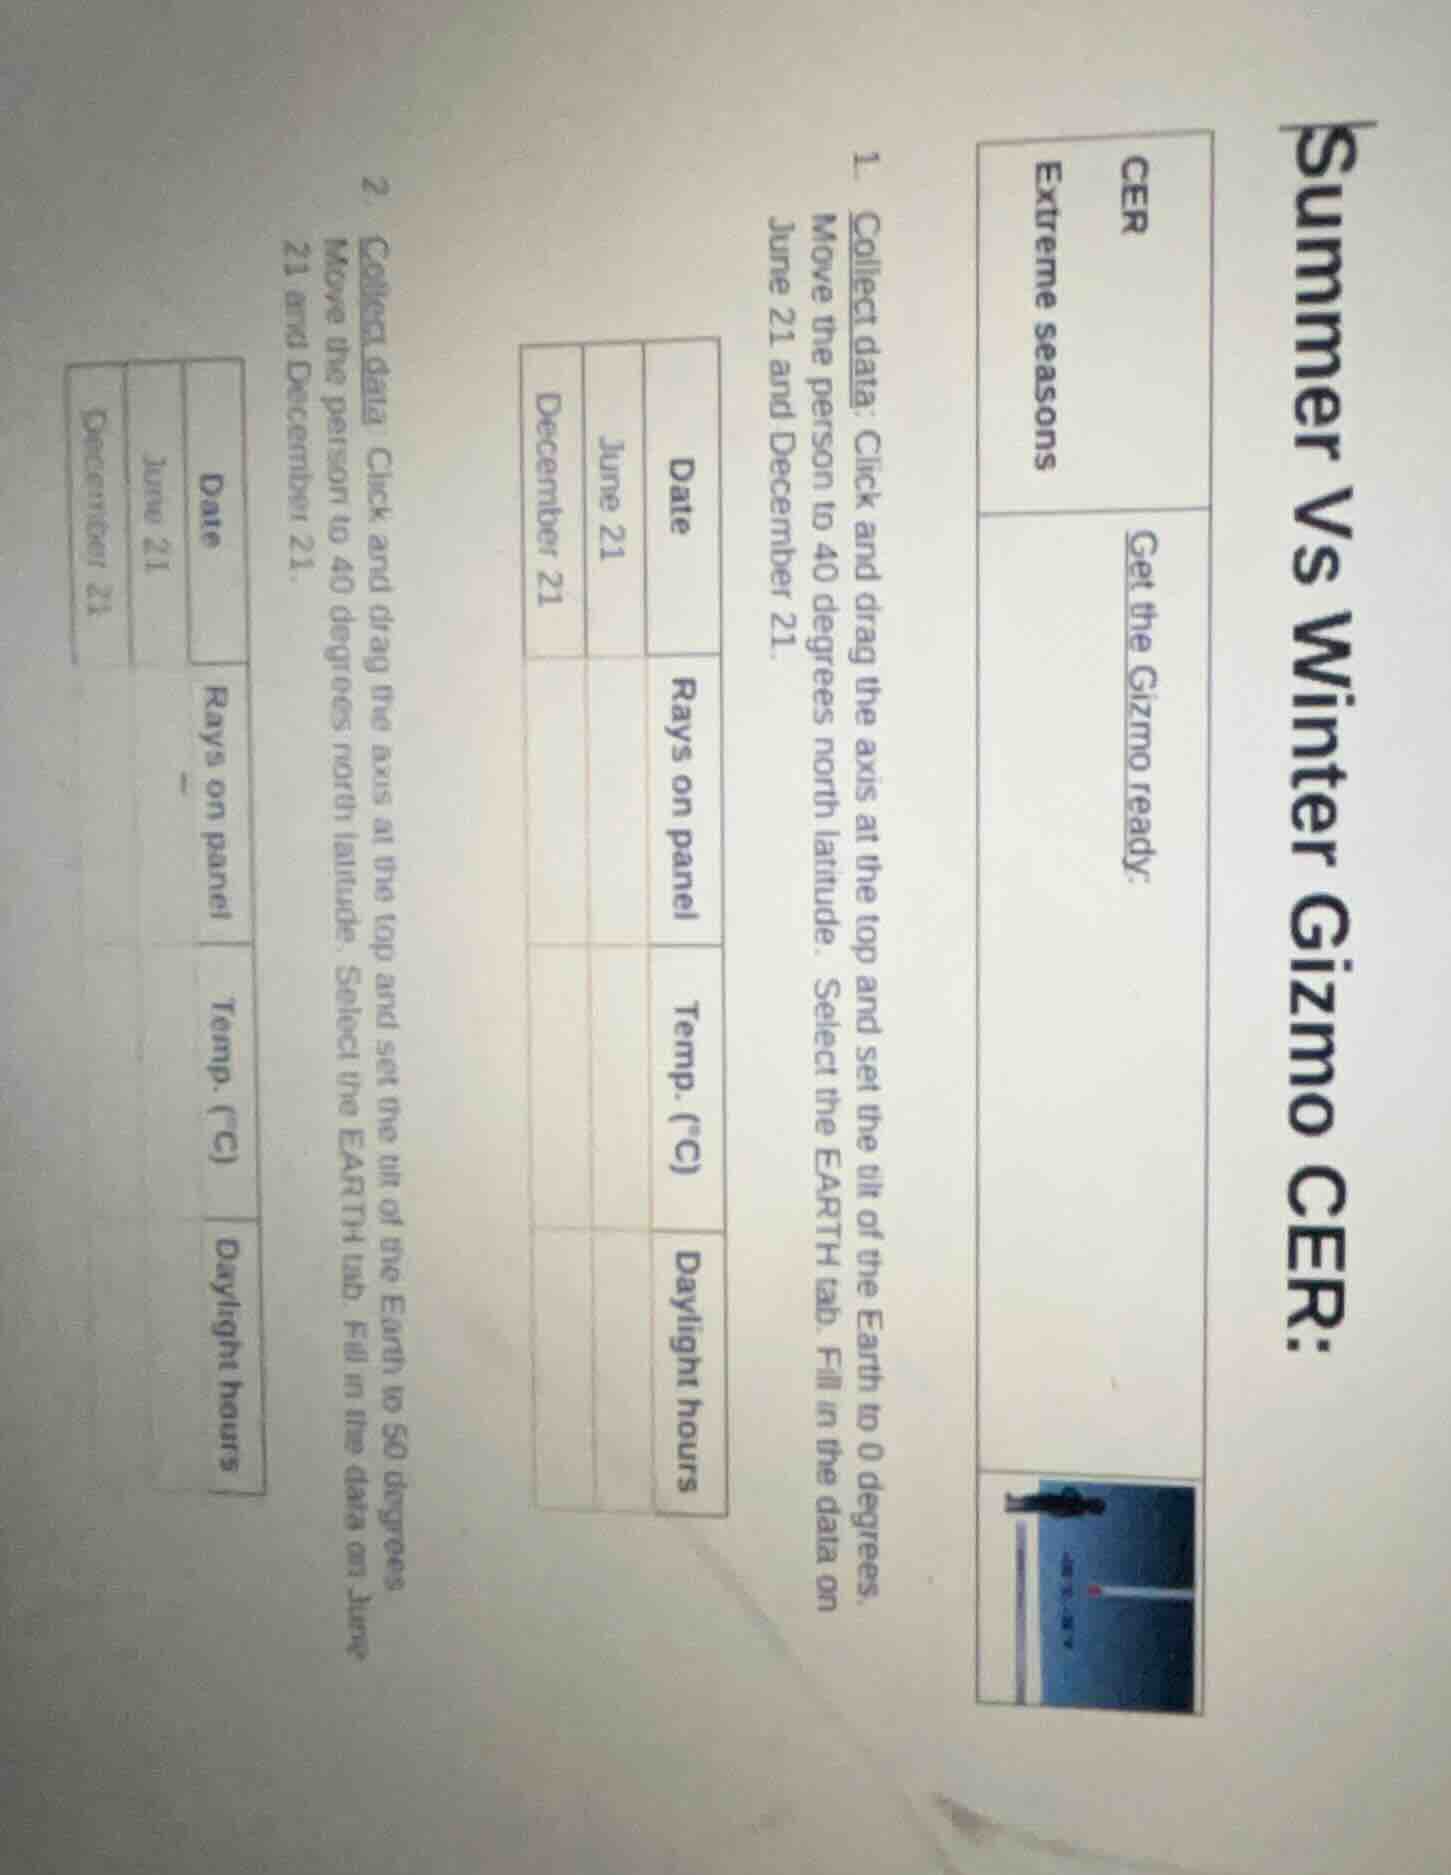
summer vs winter gizmo cer:
cer
extreme seasons
get the gizmo ready.
- collect data: click and drag the axis at the top and set the tilt of the earth to 0 degrees. move the person to 40 degrees north latitude. select the earth tab. fill in the data on june 21 and december 21.
date\tjune 21\tdecember 21
rays on panel\t\t
temp. (°c)\t\t
daylight hours\t\t
- collect data: click and drag the axis at the top and set the tilt of the earth to 50 degrees. move the person to 40 degrees north latitude. select the earth tab. fill in the data on june 21 and december 21.
date\tjune 21\tdecember 21
rays on panel\t\t
temp. (°c)\t\t
daylight hours\t\t
This appears to be a lab activity related to the Earth's seasons (Summer vs Winter) using a Gizmo (an interactive simulation tool, likely from an educational platform like ExploreLearning). The task involves collecting data on solar rays, temperature, and daylight hours for June 21 and December 21 at a 40° north latitude, first with the Earth's tilt set to 0° and then to 23.5° (the actual tilt of the Earth).
Step 1: Set Up the Gizmo (Tilt = 0°)
- Action: Click on the "Get the Gizmo ready" section (as per the CER - Claim, Evidence, Reasoning - format, this is the setup). Set the Earth's tilt to 0° (using the axis adjustment at the top). Move the "person" (the observer) to 40° north latitude. Select the "EARTH" tab.
- Purpose: This is the control setup (no tilt) to compare with the actual tilt (23.5°) in the next step.
Step 2: Collect Data (Tilt = 0°)
- Date 1: June 21
- Rays on panel: Observe the angle of solar rays hitting the panel at 40° north. With 0° tilt, the rays should be more direct (since the Earth's axis isn't tilted, the Sun's rays are more uniform across latitudes).
- Temp. (°C): Measure the temperature. With 0° tilt, the temperature at 40° north in June should be moderate (not as hot as actual summer, since tilt drives seasonal temperature differences).
- Daylight hours: Measure the number of daylight hours. With 0° tilt, day and night are roughly equal (12 hours each) at all latitudes, so June 21 (normally summer solstice) would have ~12 hours.
- Date 2: December 21
- Rays on panel: The angle of rays should be similar to June 21 (since no tilt), so the panel gets similar directness.
- Temp. (°C): Temperature should be similar to June 21 (no seasonal tilt, so no winter cooling).
- Daylight hours: ~12 hours (equal day/night).
Step 3: Collect Data (Tilt = 23.5°)
- Action: Adjust the Earth's tilt to 23.5° (actual tilt). Keep the observer at 40° north.
- Date 1: June 21 (Summer Solstice)
- Rays on panel: Rays are more direct (since the Northern Hemisphere is tilted toward the Sun), so the panel gets more concentrated rays.
- Temp. (°C): Higher than the 0° tilt case (more direct rays = more heating).
- Daylight hours: Longer than 12 hours (Northern Hemisphere tilted toward Sun, so more daylight).
- Date 2: December 21 (Winter Solstice)
- Rays on panel: Rays are more indirect (Northern Hemisphere tilted away from the Sun), so the panel gets less concentrated rays.
- Temp. (°C): Lower than the 0° tilt case (less direct rays = less heating).
- Daylight hours: Shorter than 12 hours (Northern Hemisphere tilted away, so less daylight).
Step 4: Analyze the Data
- Compare Tilt = 0° and Tilt = 23.5°:
- Rays: With tilt (23.5°), June rays are more direct, December rays are more indirect. With 0° tilt, rays are similar in June and December.
- Temp.: With tilt, June is hotter, December is colder. With 0° tilt, temps are similar.
- Daylight: With tilt, June has more daylight, December has less. With 0° tilt, daylight is equal.
Conclusion (CER)
- Claim: The Earth's axial tilt (23.5°) causes seasonal differences in solar radiation, temperature, and daylight hours at 40° north latitude.
- Evidence: Data from Step 2 (0° tilt: equal rays, temp, daylight) vs Step 3 (23.5° tilt: direct rays, hot temp, long days in June; indirect rays, cold temp, short days in December).
- Reasoning: The tilt causes the Northern Hemisphere to receive more direct sunlight (and more daylight) in summer (June)…

Snap & solve any problem in the app
Get step-by-step solutions on Sovi AI
Photo-based solutions with guided steps
Explore more problems and detailed explanations
This appears to be a lab activity related to the Earth's seasons (Summer vs Winter) using a Gizmo (an interactive simulation tool, likely from an educational platform like ExploreLearning). The task involves collecting data on solar rays, temperature, and daylight hours for June 21 and December 21 at a 40° north latitude, first with the Earth's tilt set to 0° and then to 23.5° (the actual tilt of the Earth).
Step 1: Set Up the Gizmo (Tilt = 0°)
- Action: Click on the "Get the Gizmo ready" section (as per the CER - Claim, Evidence, Reasoning - format, this is the setup). Set the Earth's tilt to 0° (using the axis adjustment at the top). Move the "person" (the observer) to 40° north latitude. Select the "EARTH" tab.
- Purpose: This is the control setup (no tilt) to compare with the actual tilt (23.5°) in the next step.
Step 2: Collect Data (Tilt = 0°)
- Date 1: June 21
- Rays on panel: Observe the angle of solar rays hitting the panel at 40° north. With 0° tilt, the rays should be more direct (since the Earth's axis isn't tilted, the Sun's rays are more uniform across latitudes).
- Temp. (°C): Measure the temperature. With 0° tilt, the temperature at 40° north in June should be moderate (not as hot as actual summer, since tilt drives seasonal temperature differences).
- Daylight hours: Measure the number of daylight hours. With 0° tilt, day and night are roughly equal (12 hours each) at all latitudes, so June 21 (normally summer solstice) would have ~12 hours.
- Date 2: December 21
- Rays on panel: The angle of rays should be similar to June 21 (since no tilt), so the panel gets similar directness.
- Temp. (°C): Temperature should be similar to June 21 (no seasonal tilt, so no winter cooling).
- Daylight hours: ~12 hours (equal day/night).
Step 3: Collect Data (Tilt = 23.5°)
- Action: Adjust the Earth's tilt to 23.5° (actual tilt). Keep the observer at 40° north.
- Date 1: June 21 (Summer Solstice)
- Rays on panel: Rays are more direct (since the Northern Hemisphere is tilted toward the Sun), so the panel gets more concentrated rays.
- Temp. (°C): Higher than the 0° tilt case (more direct rays = more heating).
- Daylight hours: Longer than 12 hours (Northern Hemisphere tilted toward Sun, so more daylight).
- Date 2: December 21 (Winter Solstice)
- Rays on panel: Rays are more indirect (Northern Hemisphere tilted away from the Sun), so the panel gets less concentrated rays.
- Temp. (°C): Lower than the 0° tilt case (less direct rays = less heating).
- Daylight hours: Shorter than 12 hours (Northern Hemisphere tilted away, so less daylight).
Step 4: Analyze the Data
- Compare Tilt = 0° and Tilt = 23.5°:
- Rays: With tilt (23.5°), June rays are more direct, December rays are more indirect. With 0° tilt, rays are similar in June and December.
- Temp.: With tilt, June is hotter, December is colder. With 0° tilt, temps are similar.
- Daylight: With tilt, June has more daylight, December has less. With 0° tilt, daylight is equal.
Conclusion (CER)
- Claim: The Earth's axial tilt (23.5°) causes seasonal differences in solar radiation, temperature, and daylight hours at 40° north latitude.
- Evidence: Data from Step 2 (0° tilt: equal rays, temp, daylight) vs Step 3 (23.5° tilt: direct rays, hot temp, long days in June; indirect rays, cold temp, short days in December).
- Reasoning: The tilt causes the Northern Hemisphere to receive more direct sunlight (and more daylight) in summer (June) and less in winter (December), leading to seasonal temperature changes. Without tilt (0°), there are no seasons (equal day/night, similar temp/rays year - round).
Example Data Table (Tilt = 0°)
| Date | Rays on panel | Temp. (°C) | Daylight hours |
|---|---|---|---|
| December 21 | Direct | 20 | 12 |
Example Data Table (Tilt = 23.5°)
| Date | Rays on panel | Temp. (°C) | Daylight hours |
|---|---|---|---|
| December 21 | Indirect | 12 | 9 |
This data shows that tilt (23.5°) creates the seasonal differences (hotter, longer days in summer; colder, shorter days in winter) that we observe in real life.