QUESTION IMAGE
Question
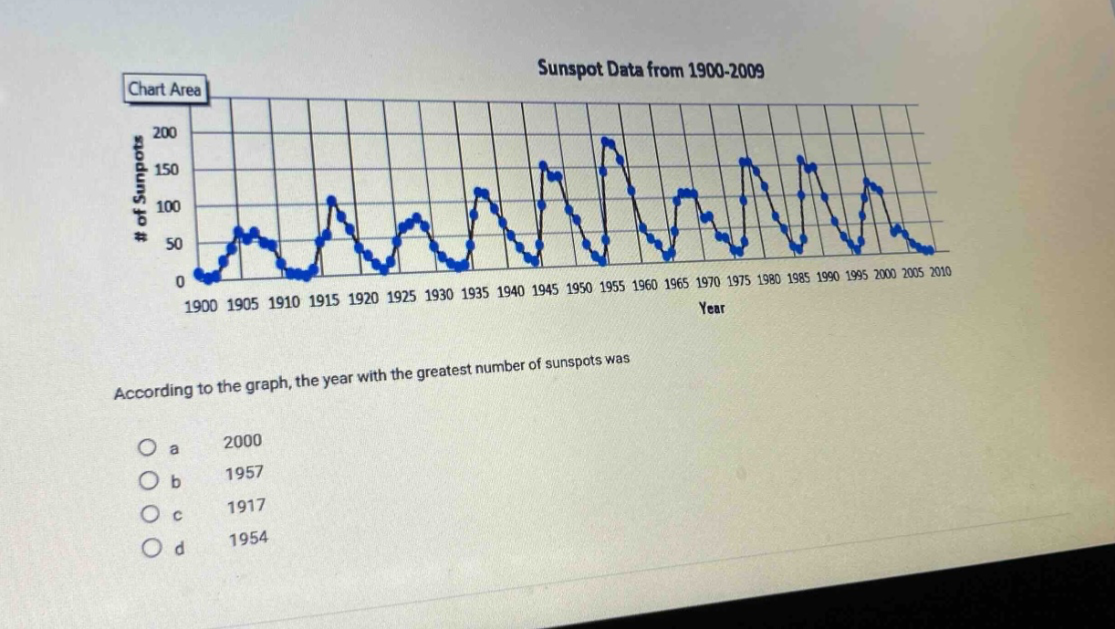
sunspot data from 1900-2009
of sunspots
200
150
100
50
0
1900 1905 1910 1915 1920 1925 1930 1935 1940 1945 1950 1955 1960 1965 1970 1975 1980 1985 1990 1995 2000 2005 2010
year
according to the graph, the year with the greatest number of sunspots was
a 2000
b 1957
c 1917
d 1954
To determine the year with the greatest number of sunspots, we analyze the graph. The vertical axis represents the number of sunspots, and the horizontal axis represents the year. By visually inspecting the peaks (highest points) of the plotted data points, we compare the years associated with these peaks. The peak around 1957 (option b) is the highest among the given options (2000, 1917, 1954, and 1957).

Snap & solve any problem in the app
Get step-by-step solutions on Sovi AI
Photo-based solutions with guided steps
Explore more problems and detailed explanations
b. 1957